Lightspeed Results Presentation Deck
Appendix B - Non-IFRS measures and ratios
16
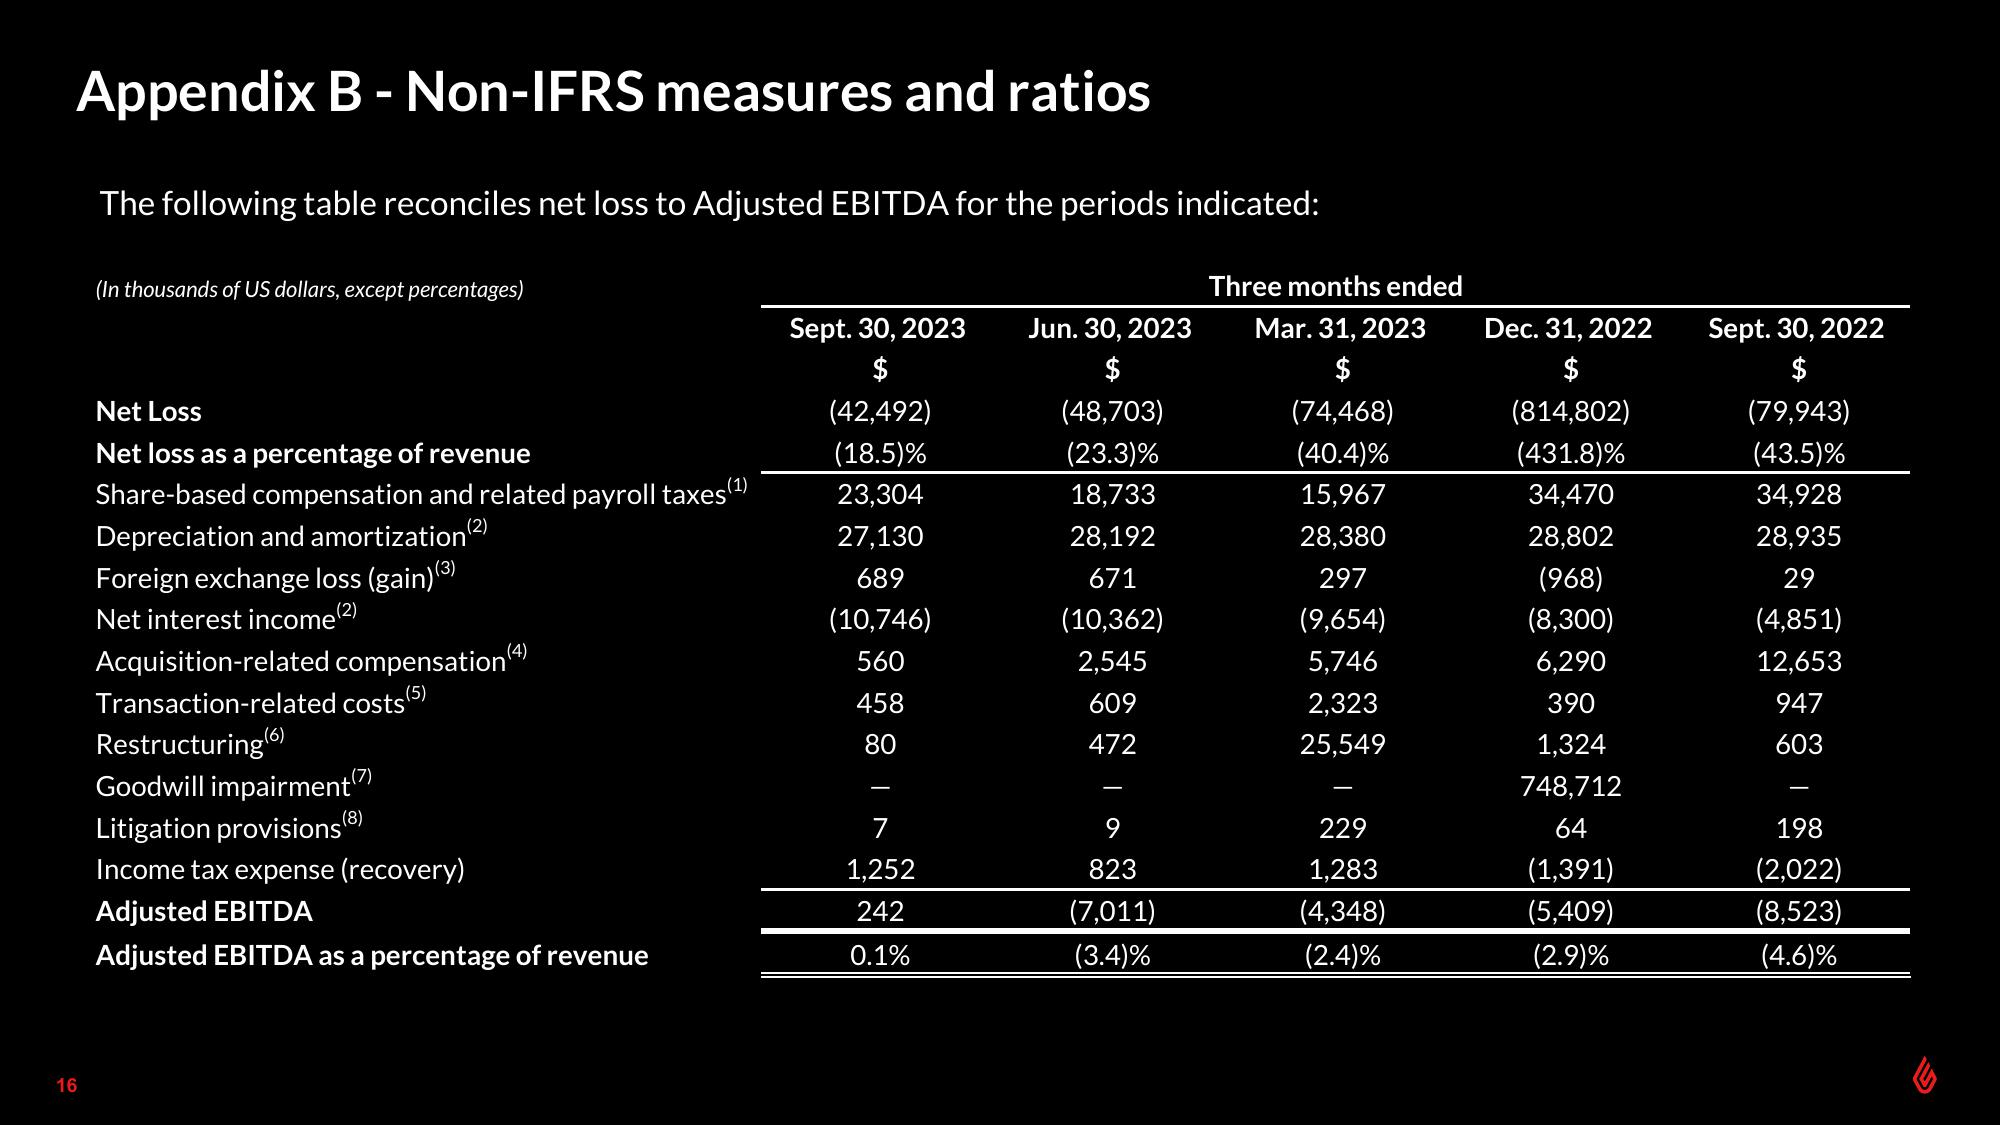
The following table reconciles net loss to Adjusted EBITDA for the periods indicated:
(In thousands of US dollars, except percentages)
Net Loss
Net loss as a percentage of revenue
Share-based compensation and related payroll taxes(¹)
Depreciation and amortization (²)
Foreign exchange loss (gain) (3)
Net interest income (2)
Acquisition-related compensation (4)
(5)
Transaction-related costs
Restructuring (6)
Goodwill impairment(7)
Litigation provisions (8)
Income tax expense (recovery)
Adjusted EBITDA
Adjusted EBITDA as a percentage of revenue
Sept. 30, 2023
$
(42,492)
(18.5)%
23,304
27,130
689
(10,746)
560
458
80
7
1,252
242
0.1%
Jun. 30, 2023
$
(48,703)
(23.3)%
18,733
28,192
671
(10,362)
2,545
609
472
9
823
(7,011)
(3.4)%
Three months ended
Mar. 31, 2023
$
(74,468)
(40.4)%
15,967
28,380
297
(9,654)
5,746
2,323
25,549
229
1,283
(4,348)
(2.4)%
Dec. 31, 2022
$
(814,802)
(431.8)%
34,470
28,802
(968)
(8,300)
6,290
390
1,324
748,712
64
(1,391)
(5,409)
(2.9)%
Sept. 30, 2022
$
(79,943)
(43.5)%
34,928
28,935
29
(4,851)
12,653
947
603
198
(2,022)
(8,523)
(4.6)%View entire presentation