Sotheby's Investor Presentation Deck
APPENDIX
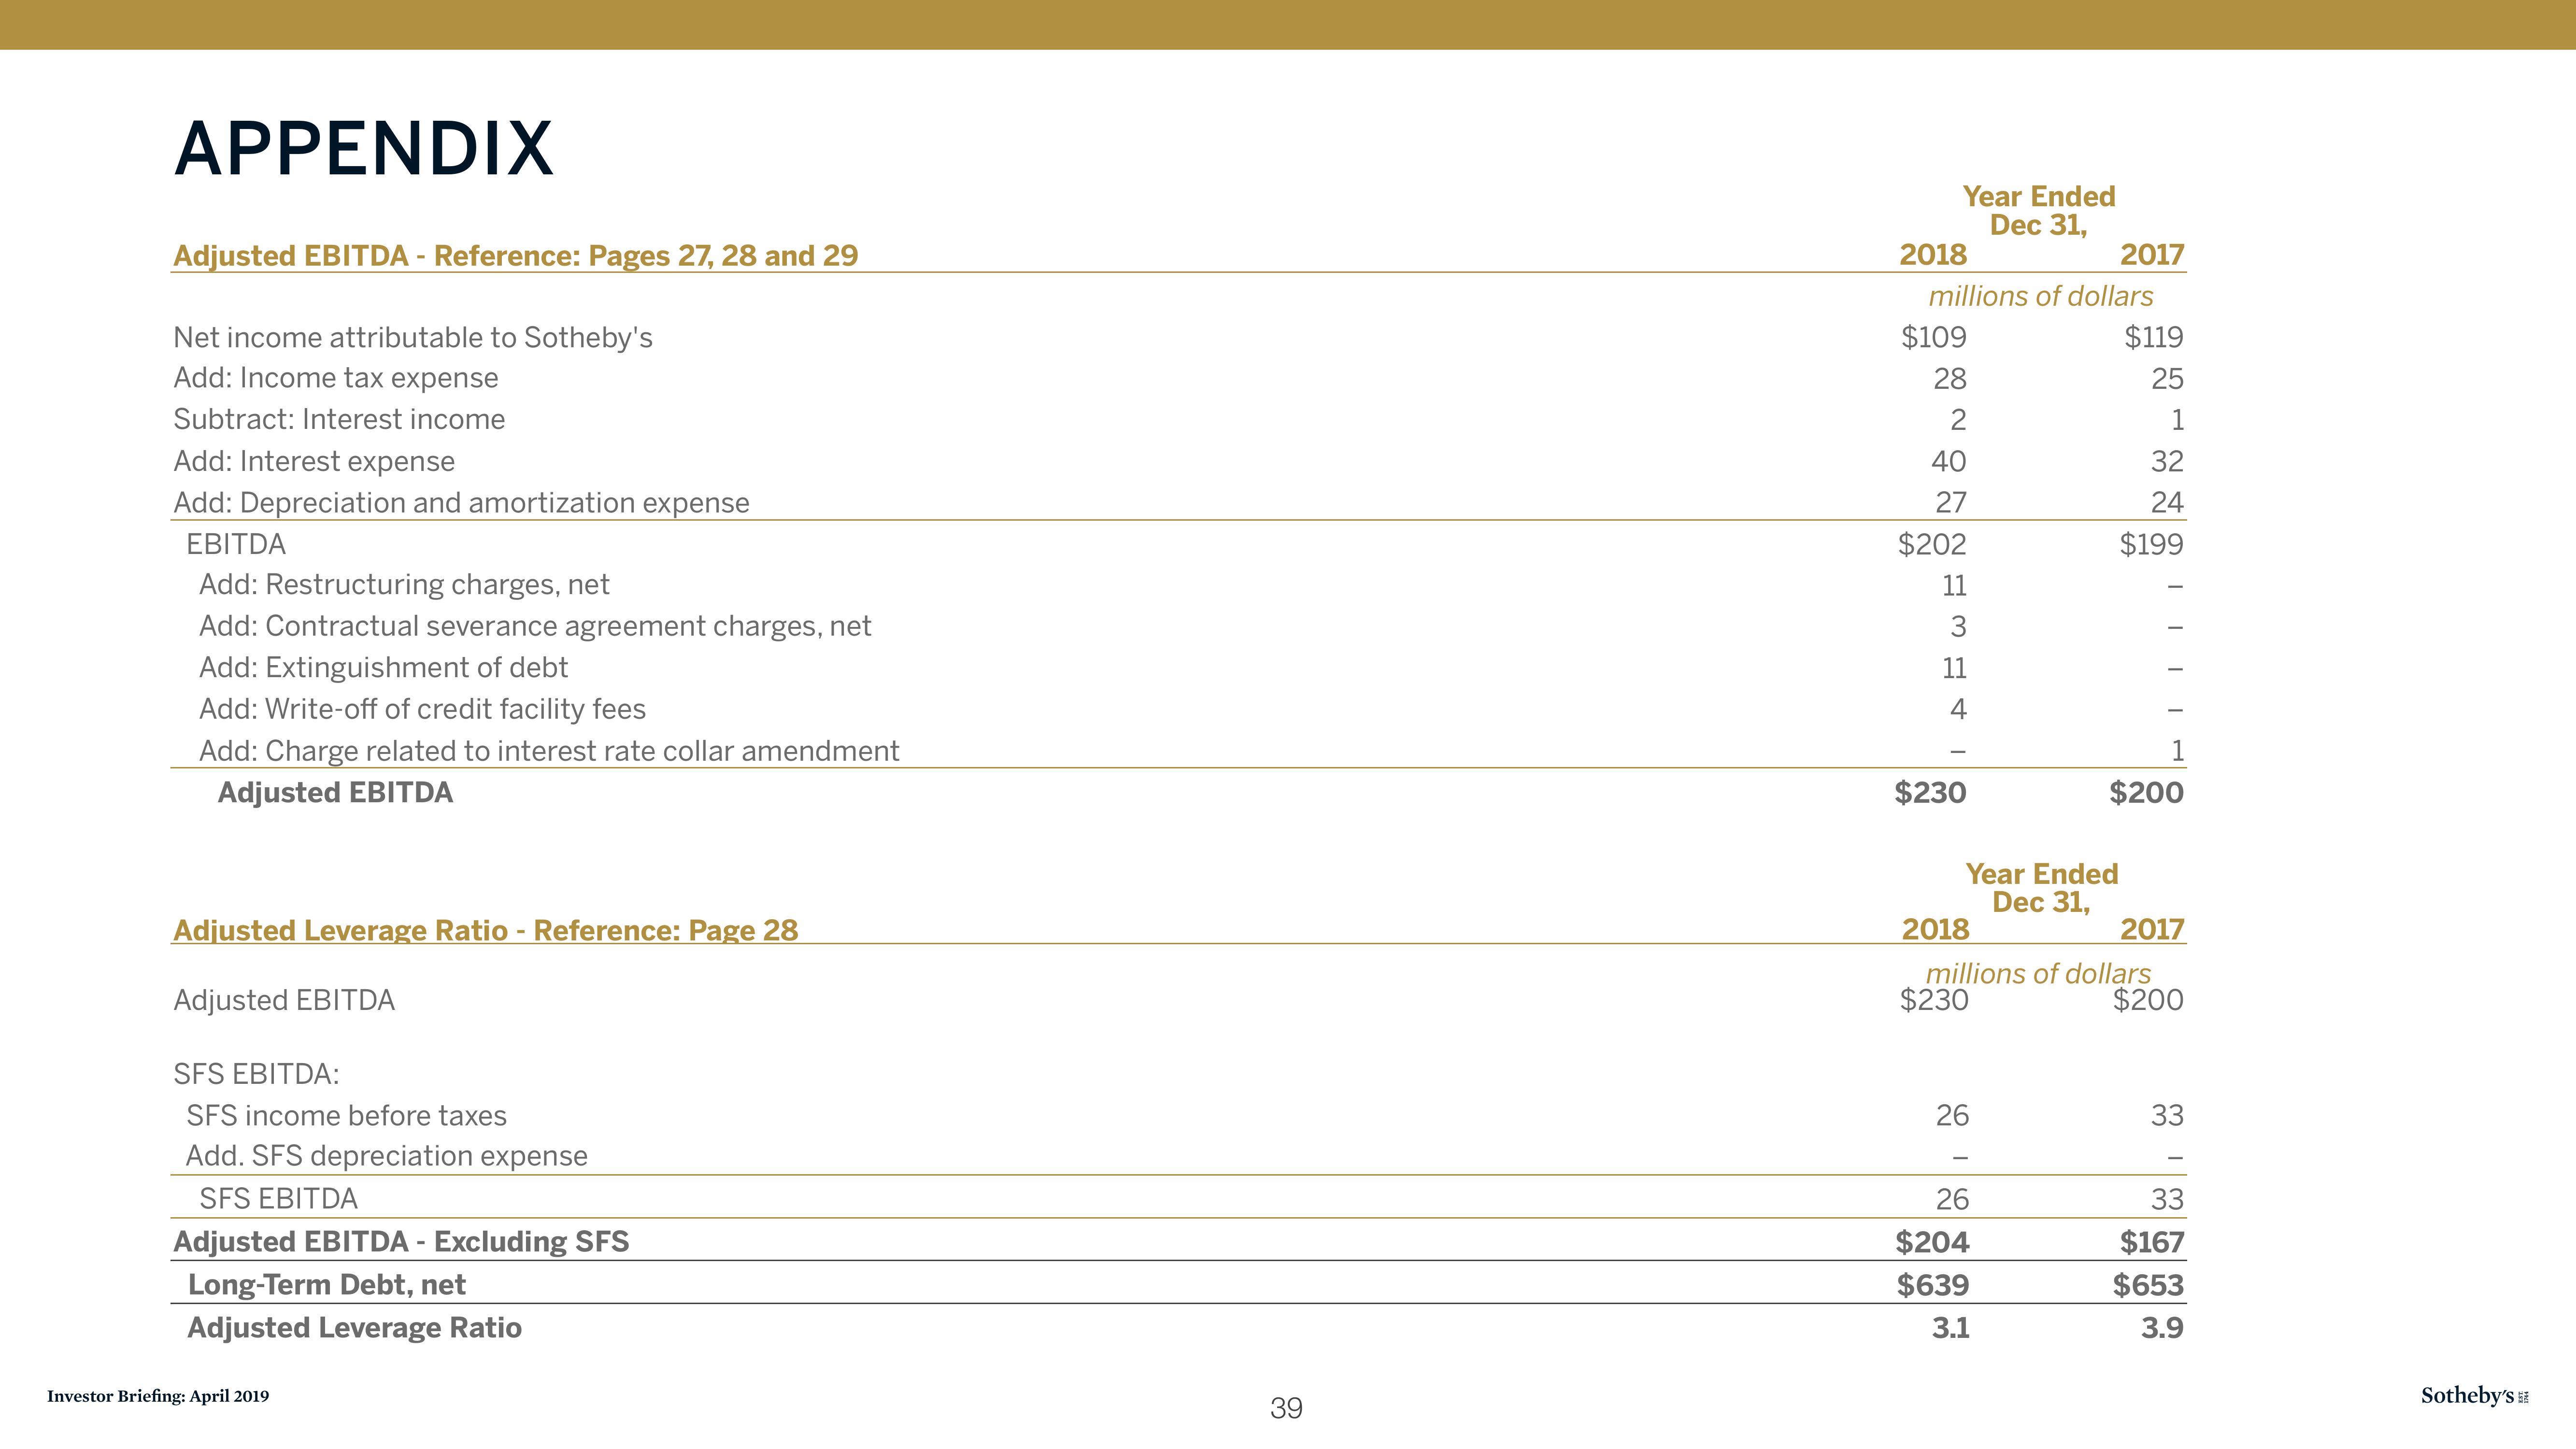
Adjusted EBITDA - Reference: Pages 27, 28 and 29
Net income attributable to Sotheby's
Add: Income tax expense
Subtract: Interest income
Add: Interest expense
Add: Depreciation and amortization expense
EBITDA
Add: Restructuring charges, net
Add: Contractual severance agreement charges, net
Add: Extinguishment of debt
Add: Write-off of credit facility fees
Add: Charge related to interest rate collar amendment
Adjusted EBITDA
Adjusted Leverage Ratio - Reference: Page 28
Adjusted EBITDA
SFS EBITDA:
SFS income before taxes
Add. SFS depreciation expense
SFS EBITDA
Adjusted EBITDA - Excluding SFS
Long-Term Debt, net
Adjusted Leverage Ratio
Investor Briefing: April 2019
39
Year Ended
Dec 31,
2018
millions of dollars
$109
28
2
40
27
$202
11
3
11
4
$230
Year Ended
Dec 31,
2017
26
26
$204
$639
3.1
$119
25
1
32
24
$199
1
$200
2018
millions of dollars
$230
2017
$200
33
33
$167
$653
3.9
Sotheby'sView entire presentation