Fiverr Investor Presentation Deck
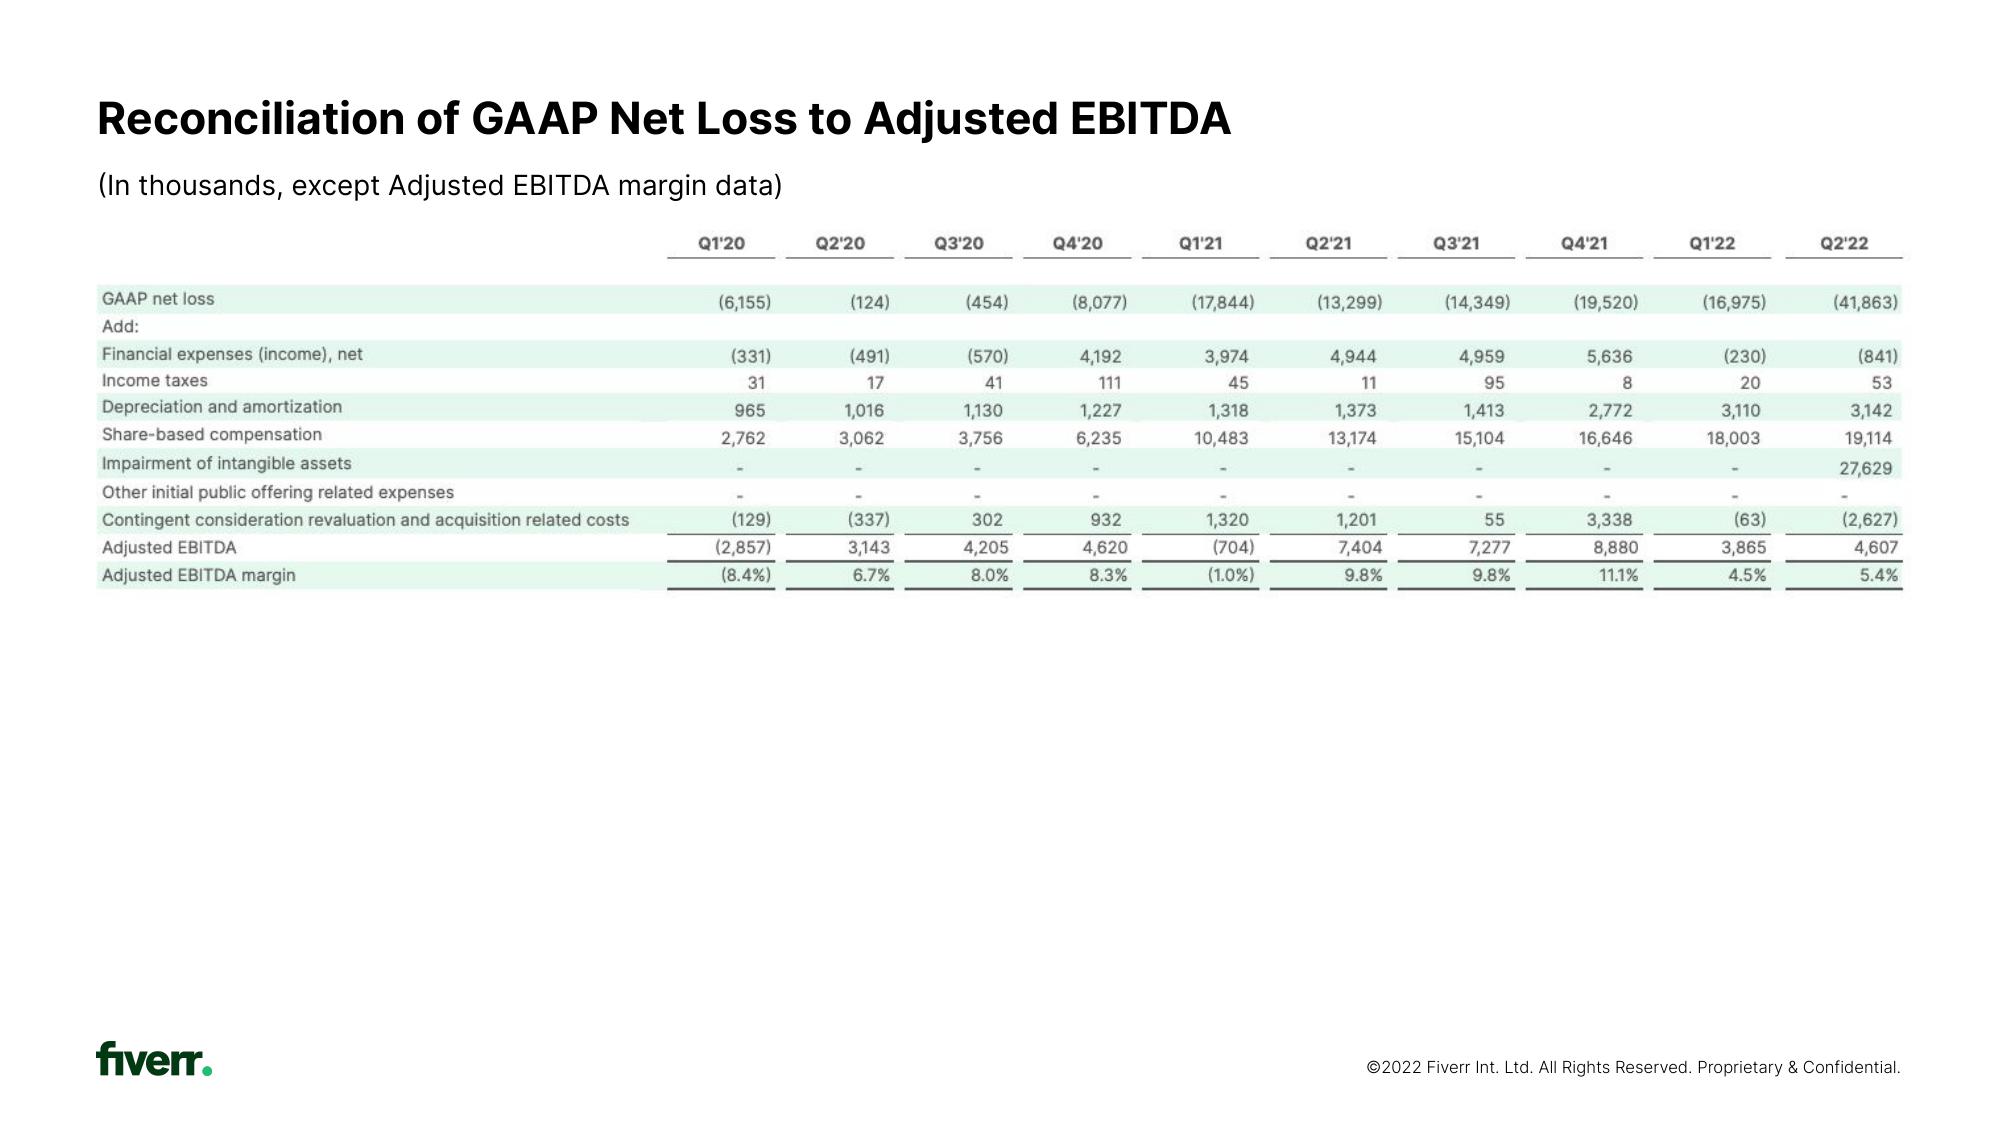
Reconciliation of GAAP Net Loss to Adjusted EBITDA
(In thousands, except Adjusted EBITDA margin data)
GAAP net loss
Add:
Financial expenses (income), net
Income taxes
Depreciation and amortization
Share-based compensation
Impairment of intangible assets
Other initial public offering related expenses
Contingent consideration revaluation and acquisition related costs
Adjusted EBITDA
Adjusted EBITDA margin
fiverr.
Q1'20
(6,155)
(331)
31
965
2,762
(129)
(2,857)
(8.4%)
Q2'20
(124)
(491)
17
1,016
3,062
(337)
3,143
6.7%
Q3'20
(454)
(570)
41
1,130
3,756
302
4,205
8.0%
Q4'20
(8,077)
4,192
111
1,227
6,235
932
4,620
8.3%
Q1'21
(17,844)
3,974
45
1,318
10,483
1,320
(704)
(1.0%)
Q2¹21
(13,299)
4,944
11
1,373
13,174
1,201
7,404
9.8%
Q3'21
(14,349)
4,959
95
1,413
15,104
55
7,277
9.8%
Q4'21
(19,520)
5,636
8
2,772
16,646
3,338
8,880
11.1%
Q1'22
(16,975)
(230)
20
3,110
18,003
(63)
3,865
4.5%
Q2'22
(41,863)
(841)
53
3,142
19,114
27,629
(2,627)
4,607
5.4%
Ⓒ2022 Fiverr Int. Ltd. All Rights Reserved. Proprietary & Confidential.View entire presentation