Hanmi Financial Results Presentation Deck
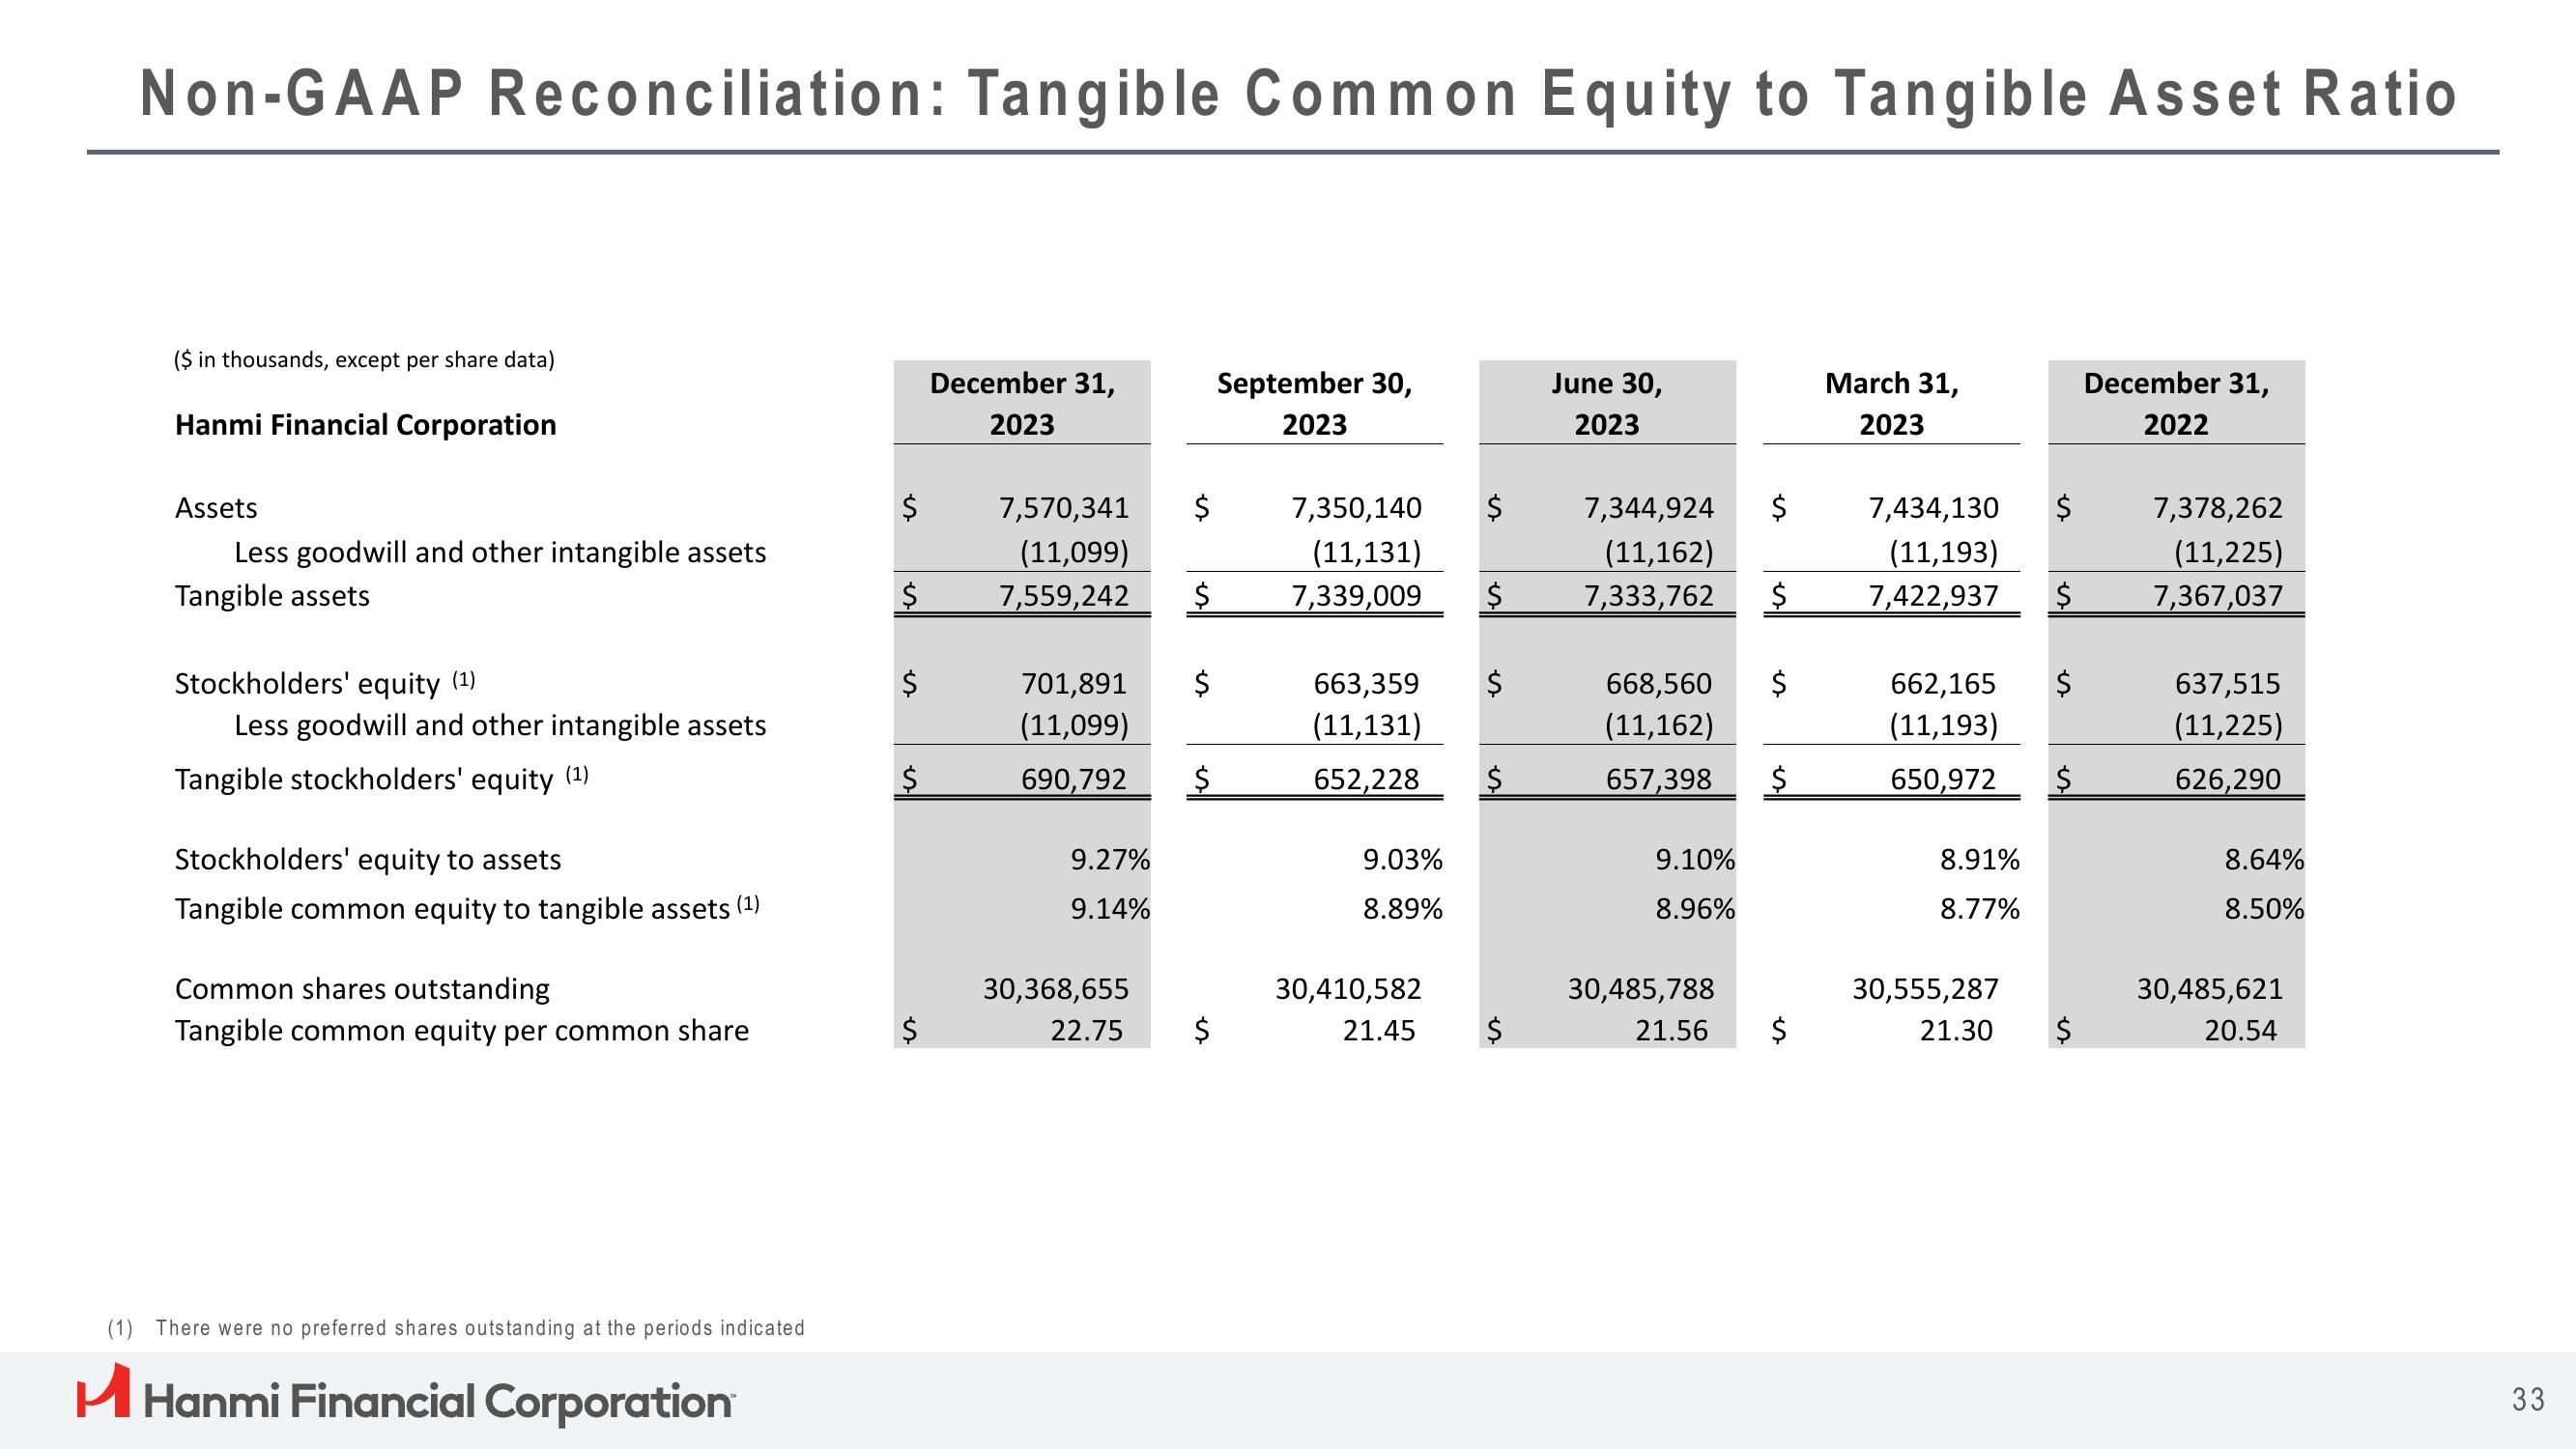
Non-GAAP Reconciliation: Tangible Common Equity to Tangible Asset Ratio
($ in thousands, except per share data)
Hanmi Financial Corporation
Assets
Less goodwill and other intangible assets
Tangible assets
Stockholders' equity (1)
Less goodwill and other intangible assets
Tangible stockholders' equity (1)
Stockholders' equity to assets
Tangible common equity to tangible assets (¹)
Common shares outstanding
Tangible common equity per common share
(1) There were no preferred shares outstanding at the periods indicated
H Hanmi Financial Corporation
$
$
$
$
December 31,
2023
7,570,341 $
(11,099)
7,559,242
9.27%
9.14%
$
701,891
(11,099)
690,792 $
30,368,655
22.75
$
September 30,
2023
7,350,140 $
(11,131)
7,339,009
663,359
(11,131)
652,228 $
9.03%
8.89%
30,410,582
21.45
June 30,
2023
7,344,924 $
(11,162)
$ 7,333,762
668,560 $
(11,162)
657,398 $
9.10%
8.96%
$
30,485,788
21.56
March 31,
2023
7,434,130 $
(11,193)
7,422,937 $
662,165
(11,193)
650,972 $
8.91%
8.77%
$
30,555,287
21.30
$
December 31,
2022
7,378,262
(11,225)
7,367,037
637,515
(11,225)
626,290
8.64%
8.50%
30,485,621
20.54
33View entire presentation