dLocal Investor Day Presentation Deck
2
TPV composition
by annual
cohort ($M)
297
260
188/
EG
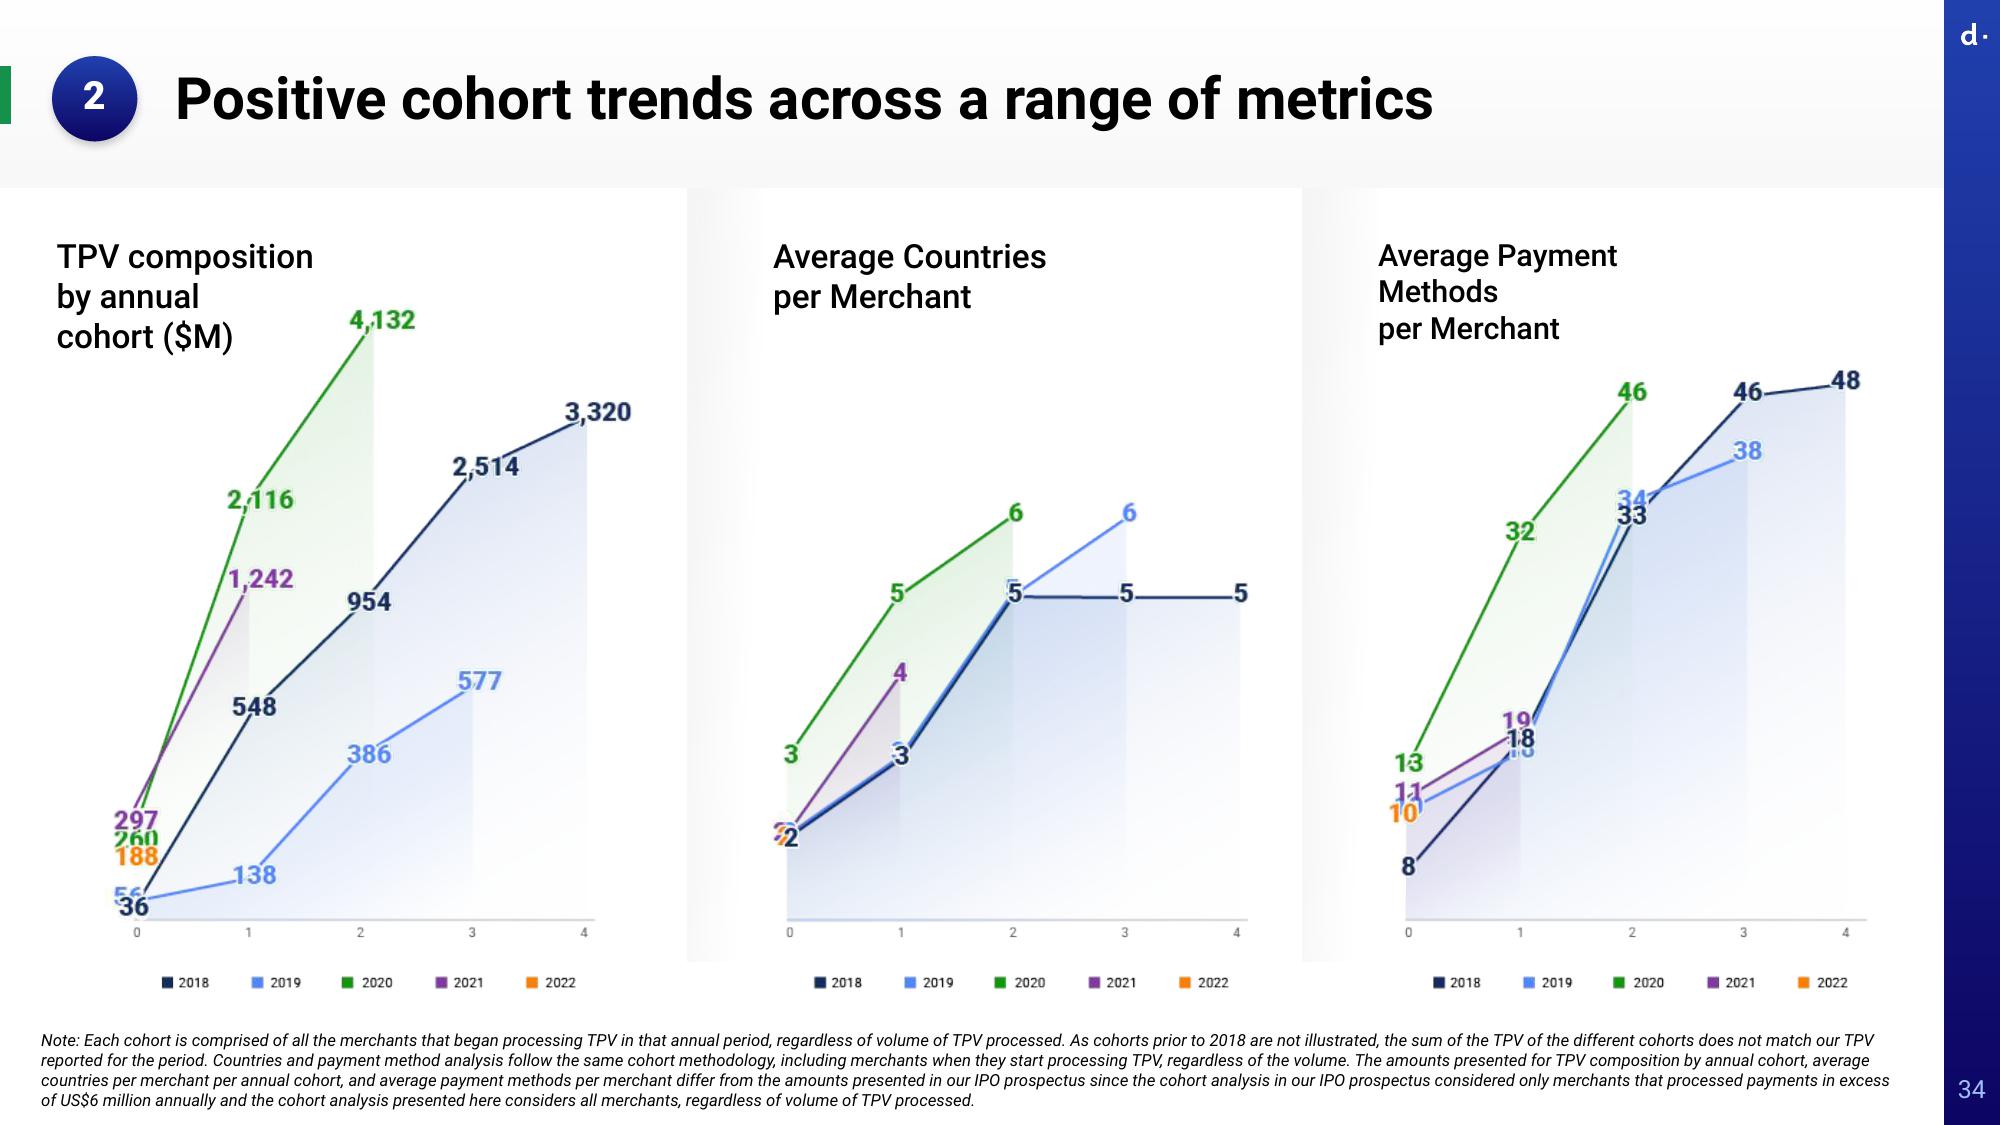
Positive cohort trends across a range of metrics
36
0
2018
2,116
1,242
548
138
2019
4,132
954
386
2
2020
2,514
577
3
2021
3,320
2022
4
Average Countries
per Merchant
3
0
2018
1
2019
2
2020
-5-
3
2021
2022
5
4
Average Payment
Methods
per Merchant
13
11
10⁰
8
0
2018
32
19
1
2019
46
347
33
2
2020
46-
38
3
2021
48
4
2022
Note: Each cohort is comprised of all the merchants that began processing TPV in that annual period, regardless of volume of TPV processed. As cohorts prior to 2018 are not illustrated, the sum of the TPV of the different cohorts does not match our TPV
reported for the period. Countries and payment method analysis follow the same cohort methodology, including merchants when they start processing TPV, regardless of the volume. The amounts presented for TPV composition by annual cohort, average
countries per merchant per annual cohort, and average payment methods per merchant differ from the amounts presented in our IPO prospectus since the cohort analysis in our IPO prospectus considered only merchants that processed payments in excess
of US$6 million annually and the cohort analysis presented here considers all merchants, regardless of volume of TPV processed.
d.
34View entire presentation