Shopify Results Presentation Deck
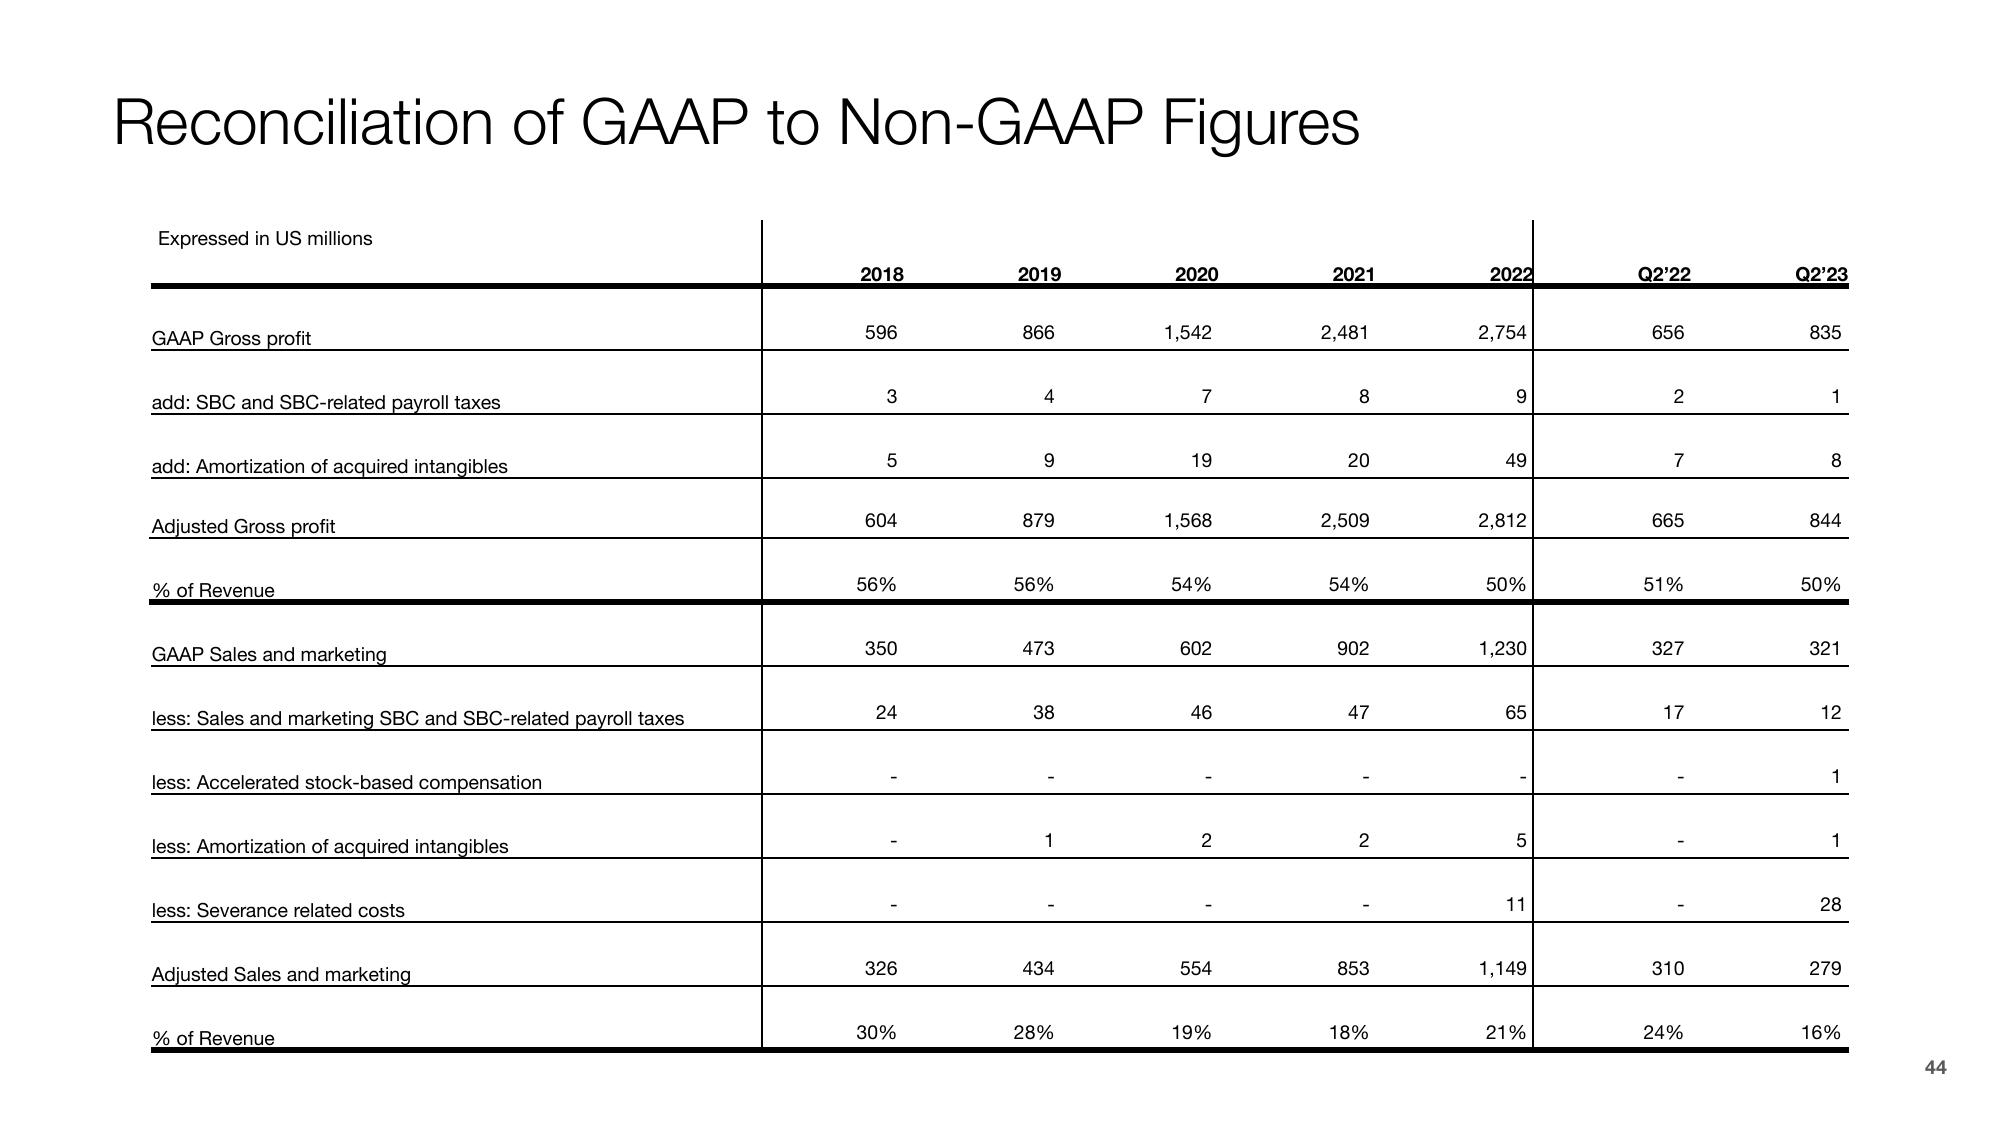
Reconciliation of GAAP to Non-GAAP Figures
Expressed in US millions
GAAP Gross profit
add: SBC and SBC-related payroll taxes
add: Amortization of acquired intangibles
Adjusted Gross profit
% of Revenue
GAAP Sales and marketing
less: Sales and marketing SBC and SBC-related payroll taxes
less: Accelerated stock-based compensation
less: Amortization of acquired intangibles
less: Severance related costs
Adjusted Sales and marketing
% of Revenue
2018
596
3
5
604
56%
350
24
326
30%
2019
866
4
9
879
56%
473
38
434
28%
2020
1,542
7
19
1,568
54%
602
46
2
554
19%
2021
2,481
8
20
2,509
54%
902
47
2
853
18%
2022
2,754
9
49
2,812
50%
1,230
65
5
11
1,149
21%
Q2'22
656
2
7
665
51%
327
17
310
24%
Q2'23
835
1
8
844
50%
321
12
1
1
28
279
16%
44View entire presentation