Hydrofarm IPO Presentation Deck
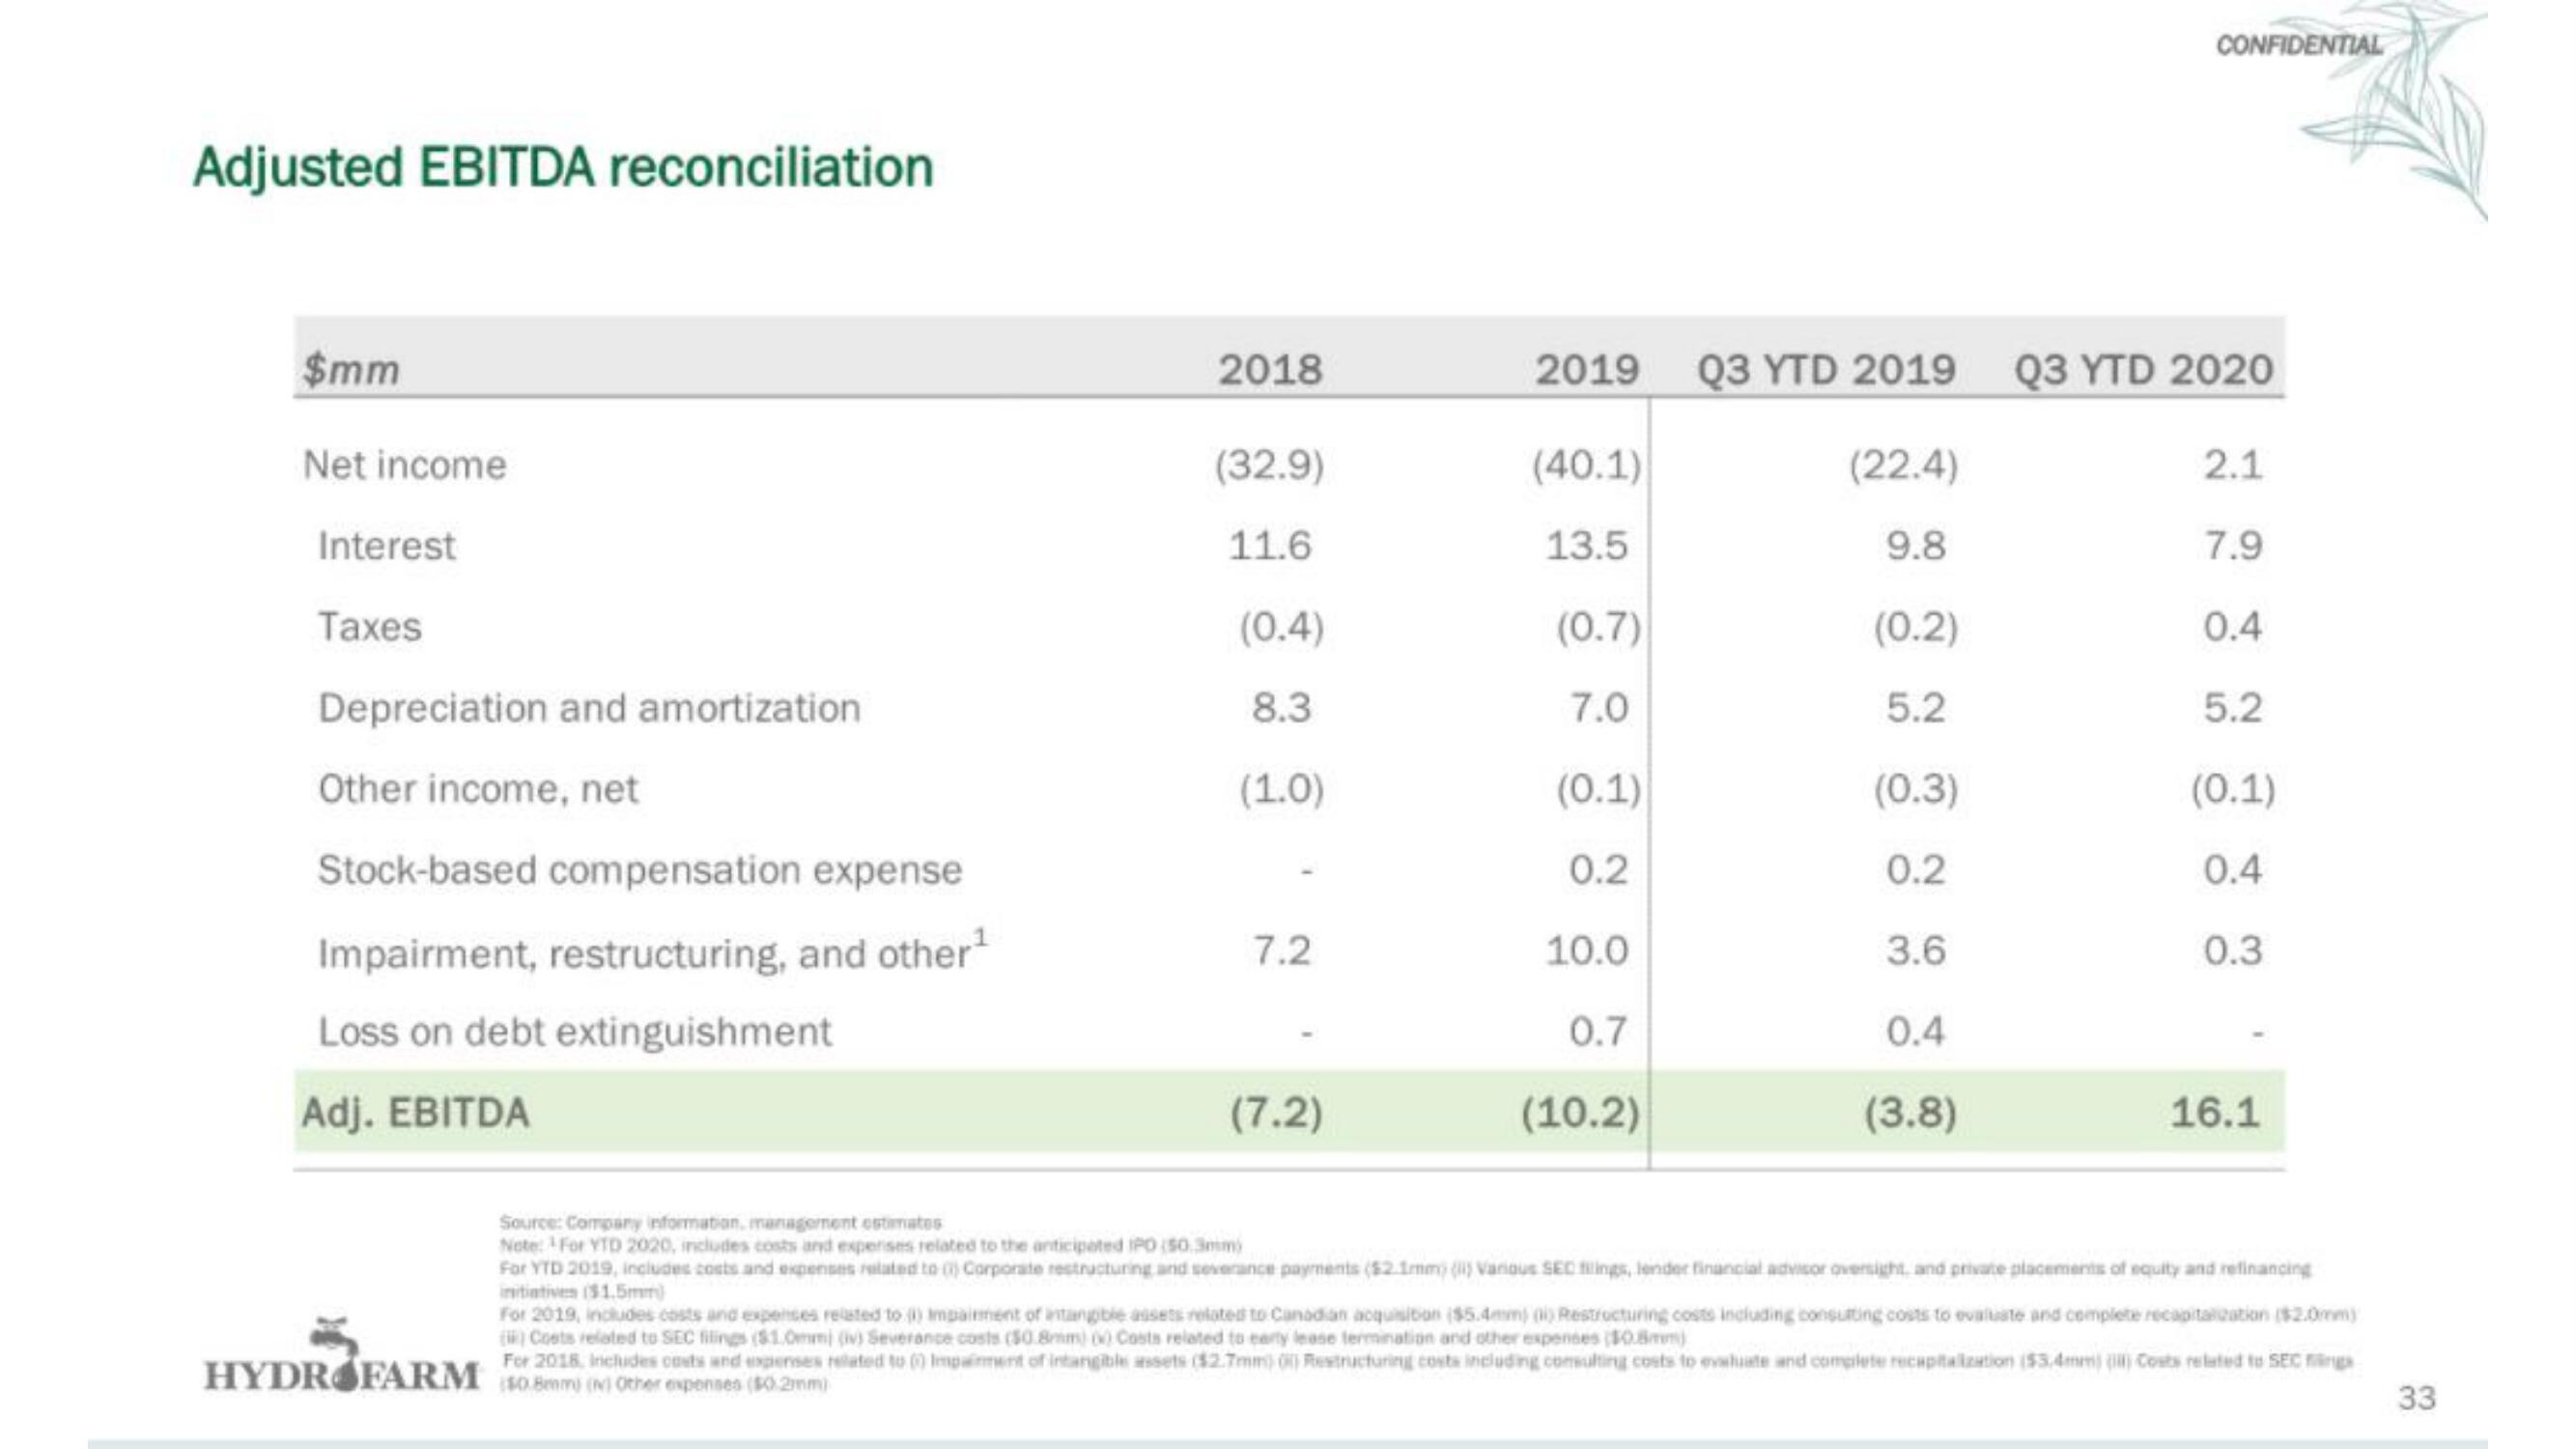
Adjusted EBITDA reconciliation
$mm
Net income
Interest
Taxes
Depreciation and amortization
Other income, net
Stock-based compensation expense
Impairment, restructuring, and other¹
Loss on debt extinguishment
Adj. EBITDA
2018
(32.9)
11.6
(0.4)
8.3
(1.0)
HYDROFARM (0.8mm (N) Other expenses ($0.2mm)
7.2
(7.2)
2019 Q3 YTD 2019
(40.1)
(22.4)
13.5
9.8
(0.2)
5.2
(0.7)
7.0
(0.1)
0.2
10.0
0.7
(10.2)
(0.3)
0.2
3.6
0.4
(3.8)
CONFIDENTIAL
Q3 YTD 2020
2.1
7.9
0.4
5.2
(0.1)
0.4
0.3
16.1
Source: Company information management estimates
Note: For YTD 2020, includes costs and expenses related to the anticipated IPO ($0.3mm)
For YTD 2019, includes costs and expenses related to 0) Corporate restructuring and severance payments ($2.1mm) (1) Various SEC filings, lender financial advisor oversight, and private placements of equity and refinancing
initiatives ($1.5mm)
For 2019, includes costs and expenses related to impairment of intangible assets related to Canadian acquisition ($5.4mm) (i) Restructuring costs including consulting costs to evaluate and complete recapitalization ($2.0mm)
() Coets related to SEC filings ($1.0mmi (iv) Severance costs (50.8mm) 0) Costs related to earty lease termination and other expenses ($0.8mm)
For 2015, Includes costs and expenses related to 0) Impairment of intangible assets ($2.7mm) 0) Restructuring costs including consulting costs to evaluate and complete recupitalization ($5,4mm) (8) Costs related to SEC fings
33View entire presentation