First Merchants Results Presentation Deck
Loan Portfolio Insights (continued)
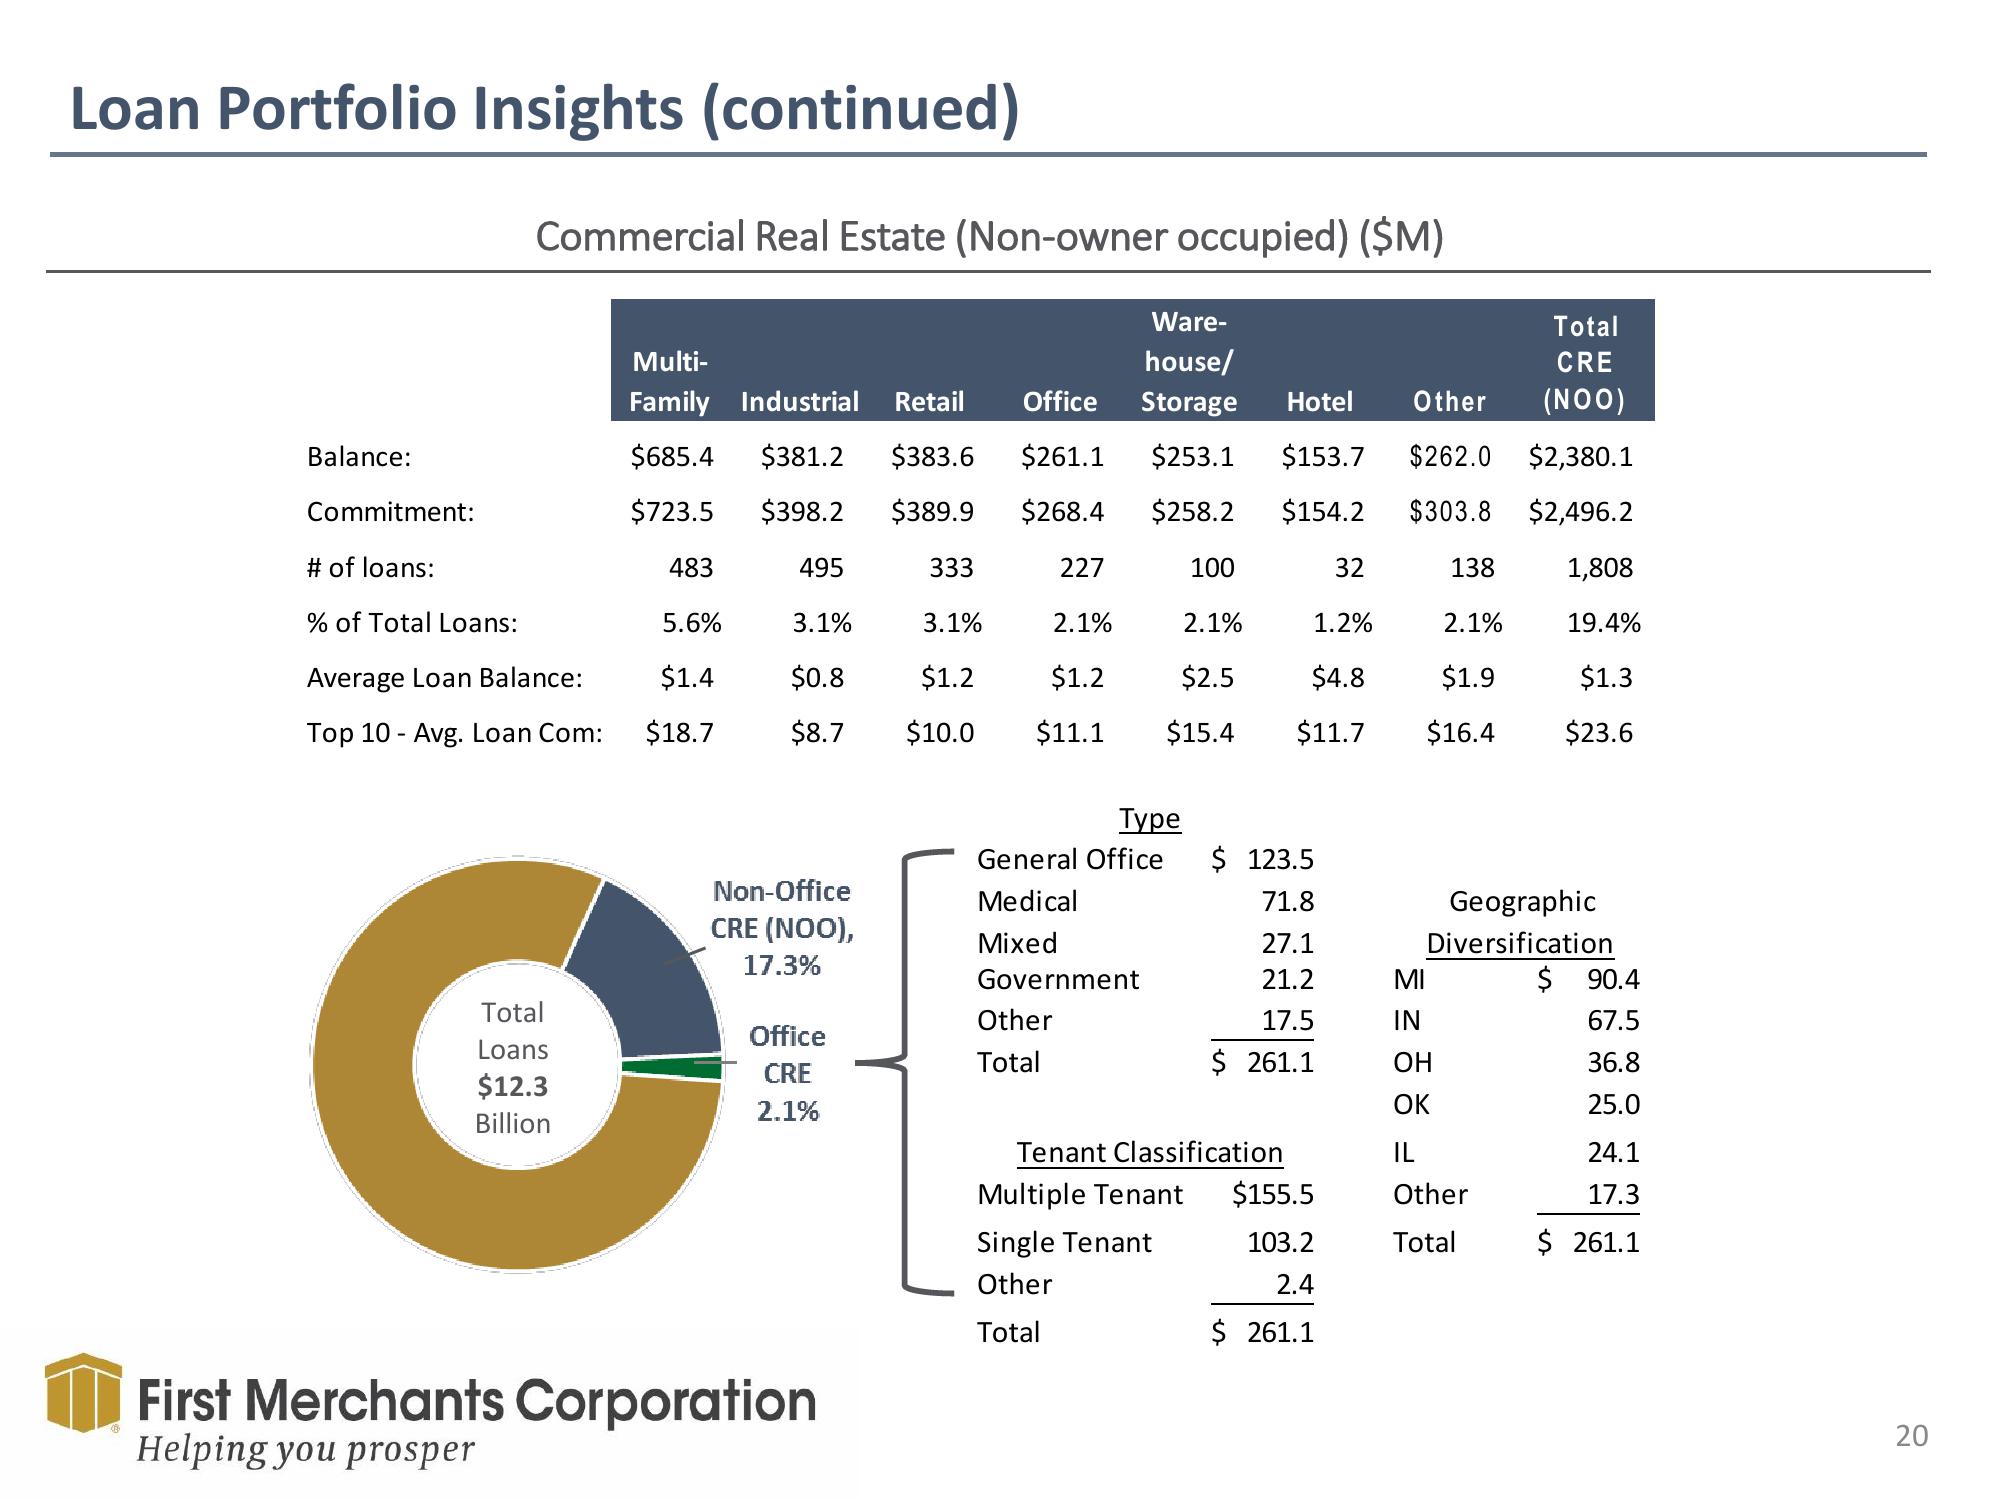
Balance:
Commercial Real Estate (Non-owner occupied) ($M)
Commitment:
# of loans:
% of Total Loans:
Average Loan Balance:
Top 10 Avg. Loan Com:
Total
Loans
$12.3
Billion
495
3.1%
$0.8
$8.7
Multi-
Family Industrial Retail Office
$685.4 $381.2 $383.6 $261.1
$398.2 $389.9 $268.4
$723.5
483
333
227
100
32
138
5.6%
3.1%
2.1%
2.1%
1.2%
2.1%
$1.4
$1.2
$1.2
$2.5
$4.8
$1.9
$18.7
$10.0 $11.1 $15.4 $11.7 $16.4
Non-Office
CRE (NOO),
17.3%
Office
CRE
2.1%
First Merchants Corporation
Helping you prosper
Ware-
house/
Storage Hotel Other
$253.1 $153.7 $262.0
$258.2 $154.2
$303.8
Type
General Office
Medical
Mixed
Government
Other
Total
$ 123.5
71.8
27.1
21.2
17.5
$ 261.1
Tenant Classification
Multiple Tenant
Single Tenant
Other
Total
$155.5
103.2
2.4
$ 261.1
Total
CRE
(NOO)
$2,380.1
$2,496.2
MI
IN
OH
OK
IL
Other
Total
1,808
19.4%
$1.3
$23.6
Geographic
Diversification
$ 90.4
67.5
36.8
25.0
24.1
17.3
$ 261.1
20View entire presentation