Rocket Companies IPO Presentation Deck
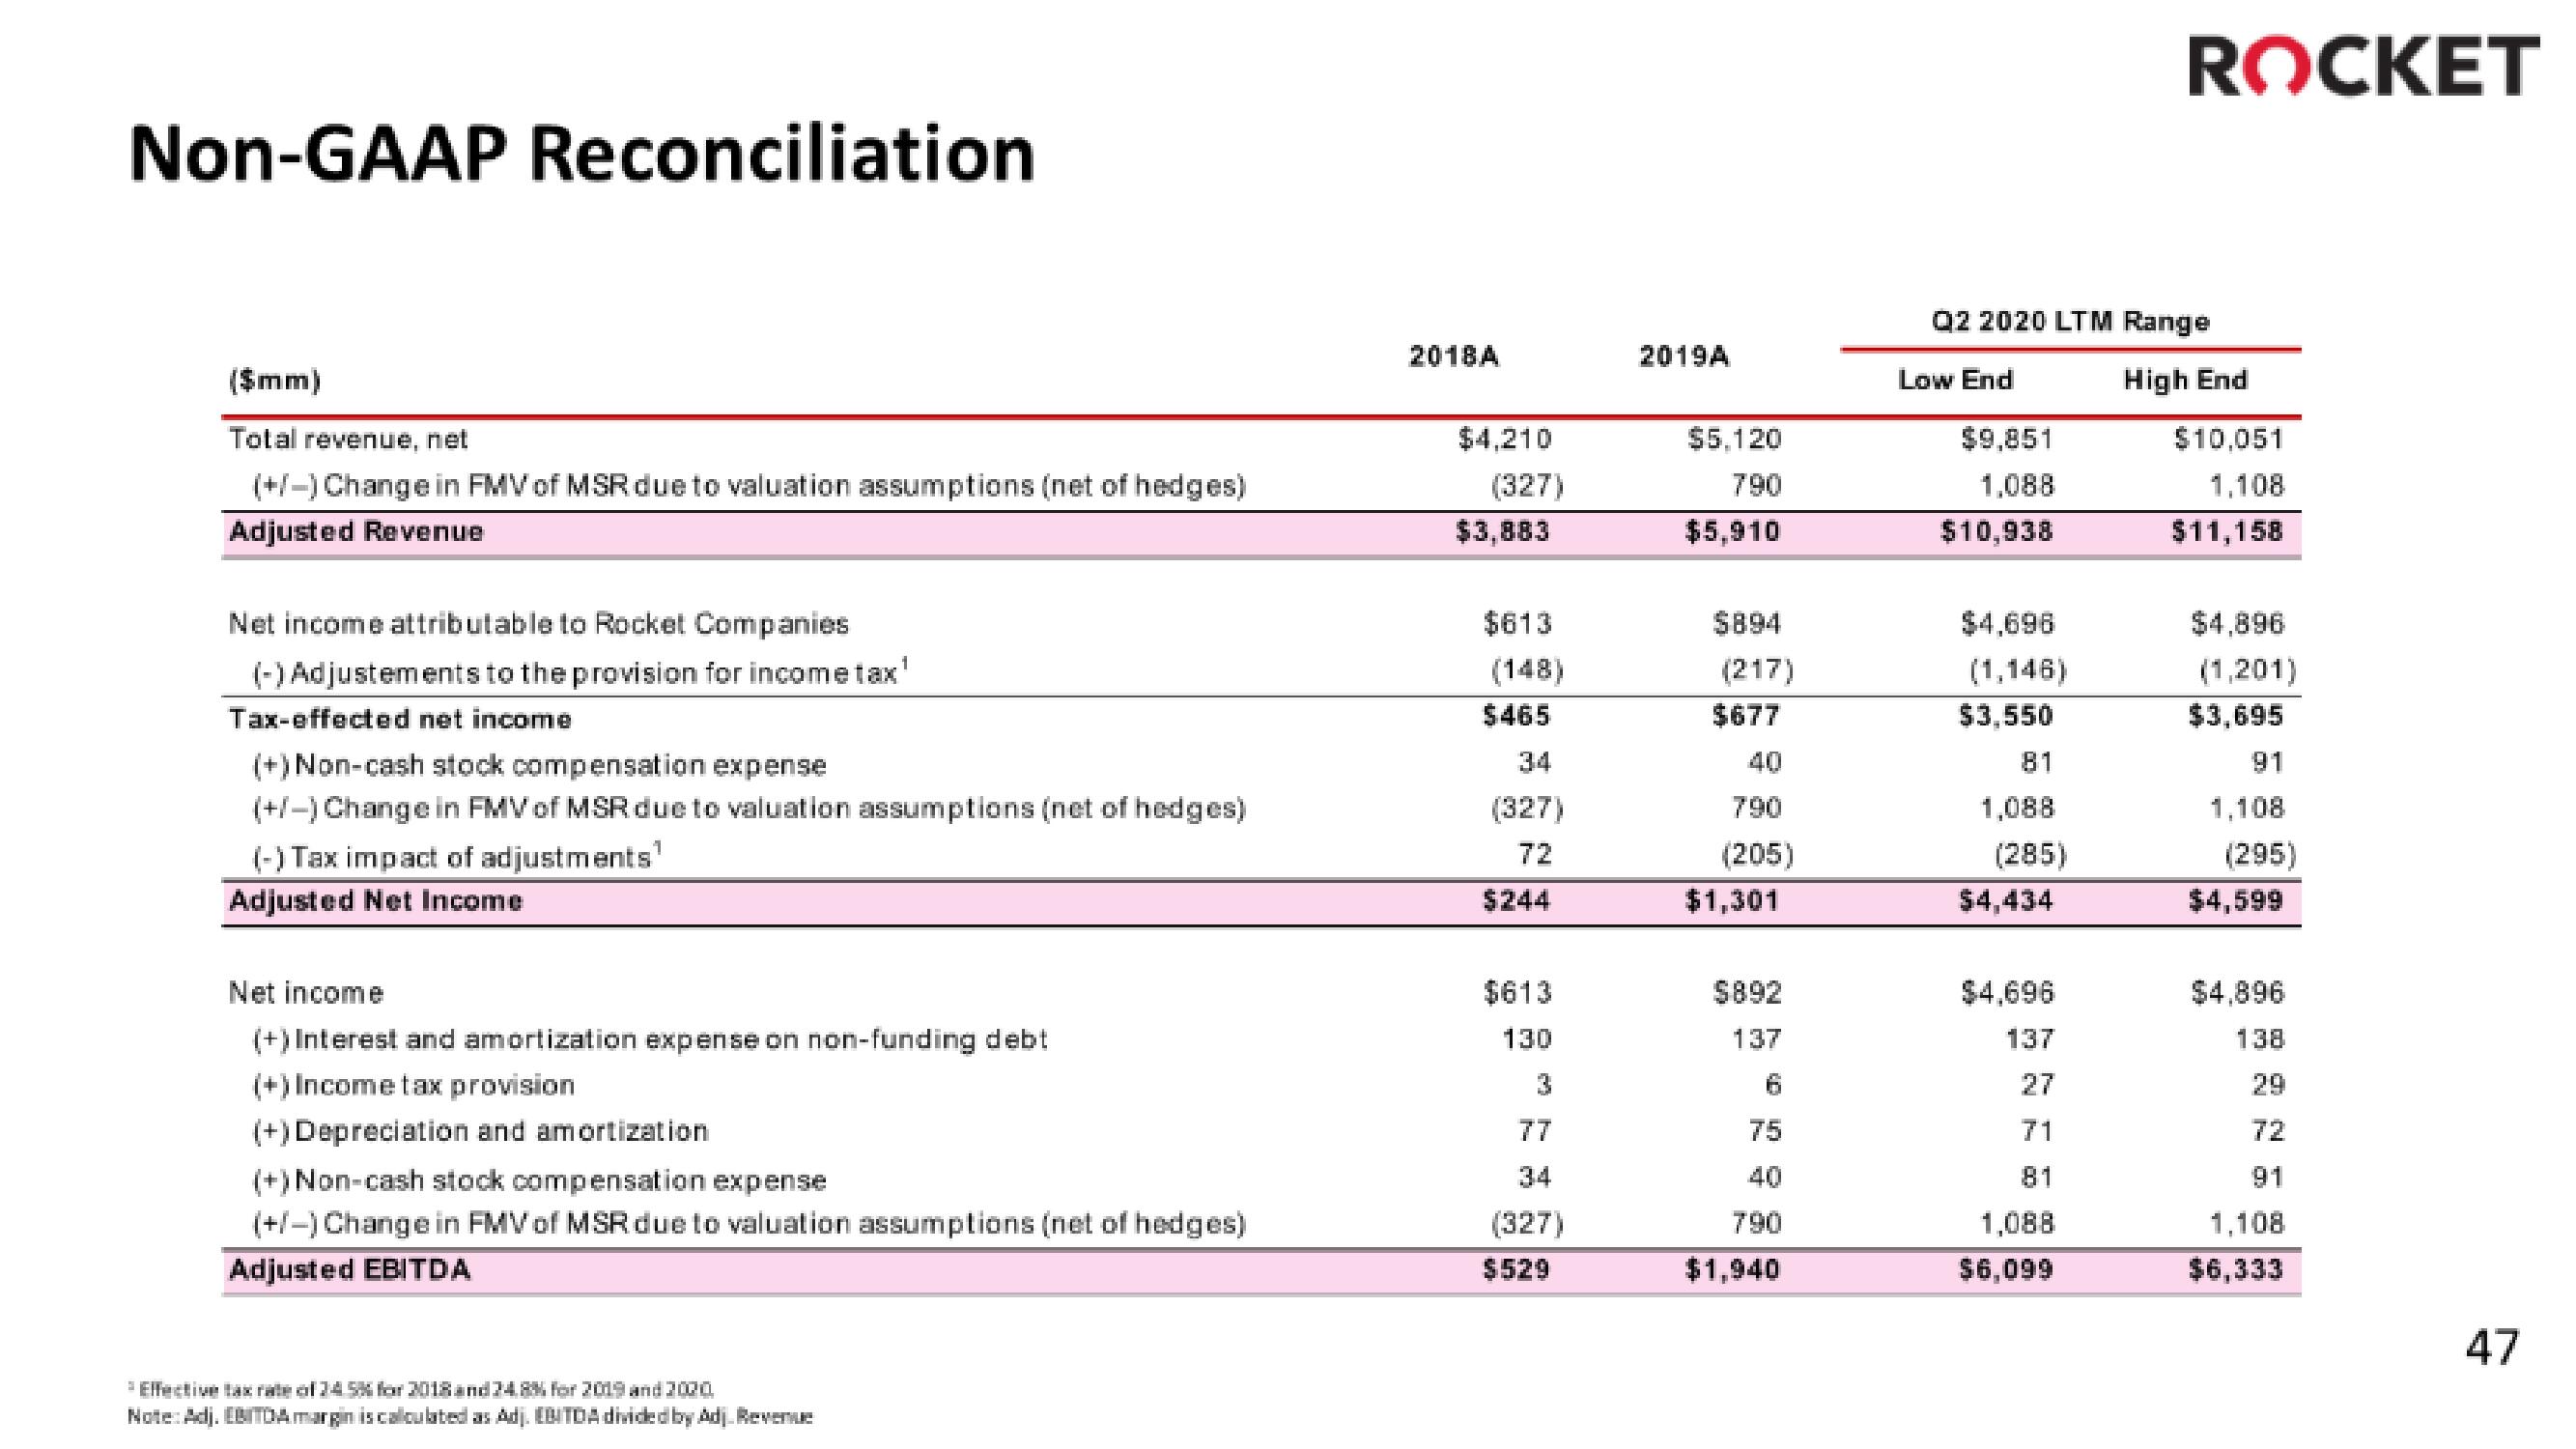
Non-GAAP Reconciliation
($mm)
Total revenue, net
(+/-) Change in FMV of MSR due to valuation assumptions (net of hedges)
Adjusted Revenue
Net income attributable to Rocket Companies
(-) Adjustements to the provision for income tax¹
Tax-effected net income
(+) Non-cash stock compensation expense
(+/-) Change in FMV of MSR due to valuation assumptions (net of hedges)
(-) Tax impact of adjustments¹
Adjusted Net Income
Net income
(+) Interest and amortization expense on non-funding debt
(+) Income tax provision
(+) Depreciation and amortization
(+) Non-cash stock compensation expense
(+/-) Change in FMV of MSR due to valuation assumptions (net of hedges)
Adjusted EBITDA
Effective tax rate of 24 5% for 2018 and 24.8% for 2019 and 2020
Note: Adj. EBITDA margin is calculated as Adj. EBITDA divided by Adj. Revenue
2018A
$4,210
(327)
$3,883
$613
$465
(327)
72
$244
$613
130
77
(327)
$529
2019A
$5,120
790
$5,910
$894
(217)
$677
40
790
(205)
$1,301
$892
137
75
40
790
$1,940
Q2 2020 LTM Range
Low End
$9,851
1.088
$10,938
$4,696
(1,146)
$3,550
81
1,088
(285)
$4,434
$4,696
137
71
ROCKET
1,088
$6,099
High End
$10,051
1,108
$11,158
$4,896
(1,201)
$3,695
91
1,108
(295)
$4,599
$4,896
138
72
91
1,108
$6,333
47View entire presentation