Crocs Results Presentation Deck
Cr
CS
cr
OCS
CI
OC
Cl
BRAND PERFORMANCE
CROCS BRAND Q3 HIGHLIGHTS
●
●
●
●
Revenues +20% CC vs. PY
North America DTC comparable sales +13%
• EMEALA +46% CC vs. PY
O
O
Asia Pacific +82% CC vs. PY
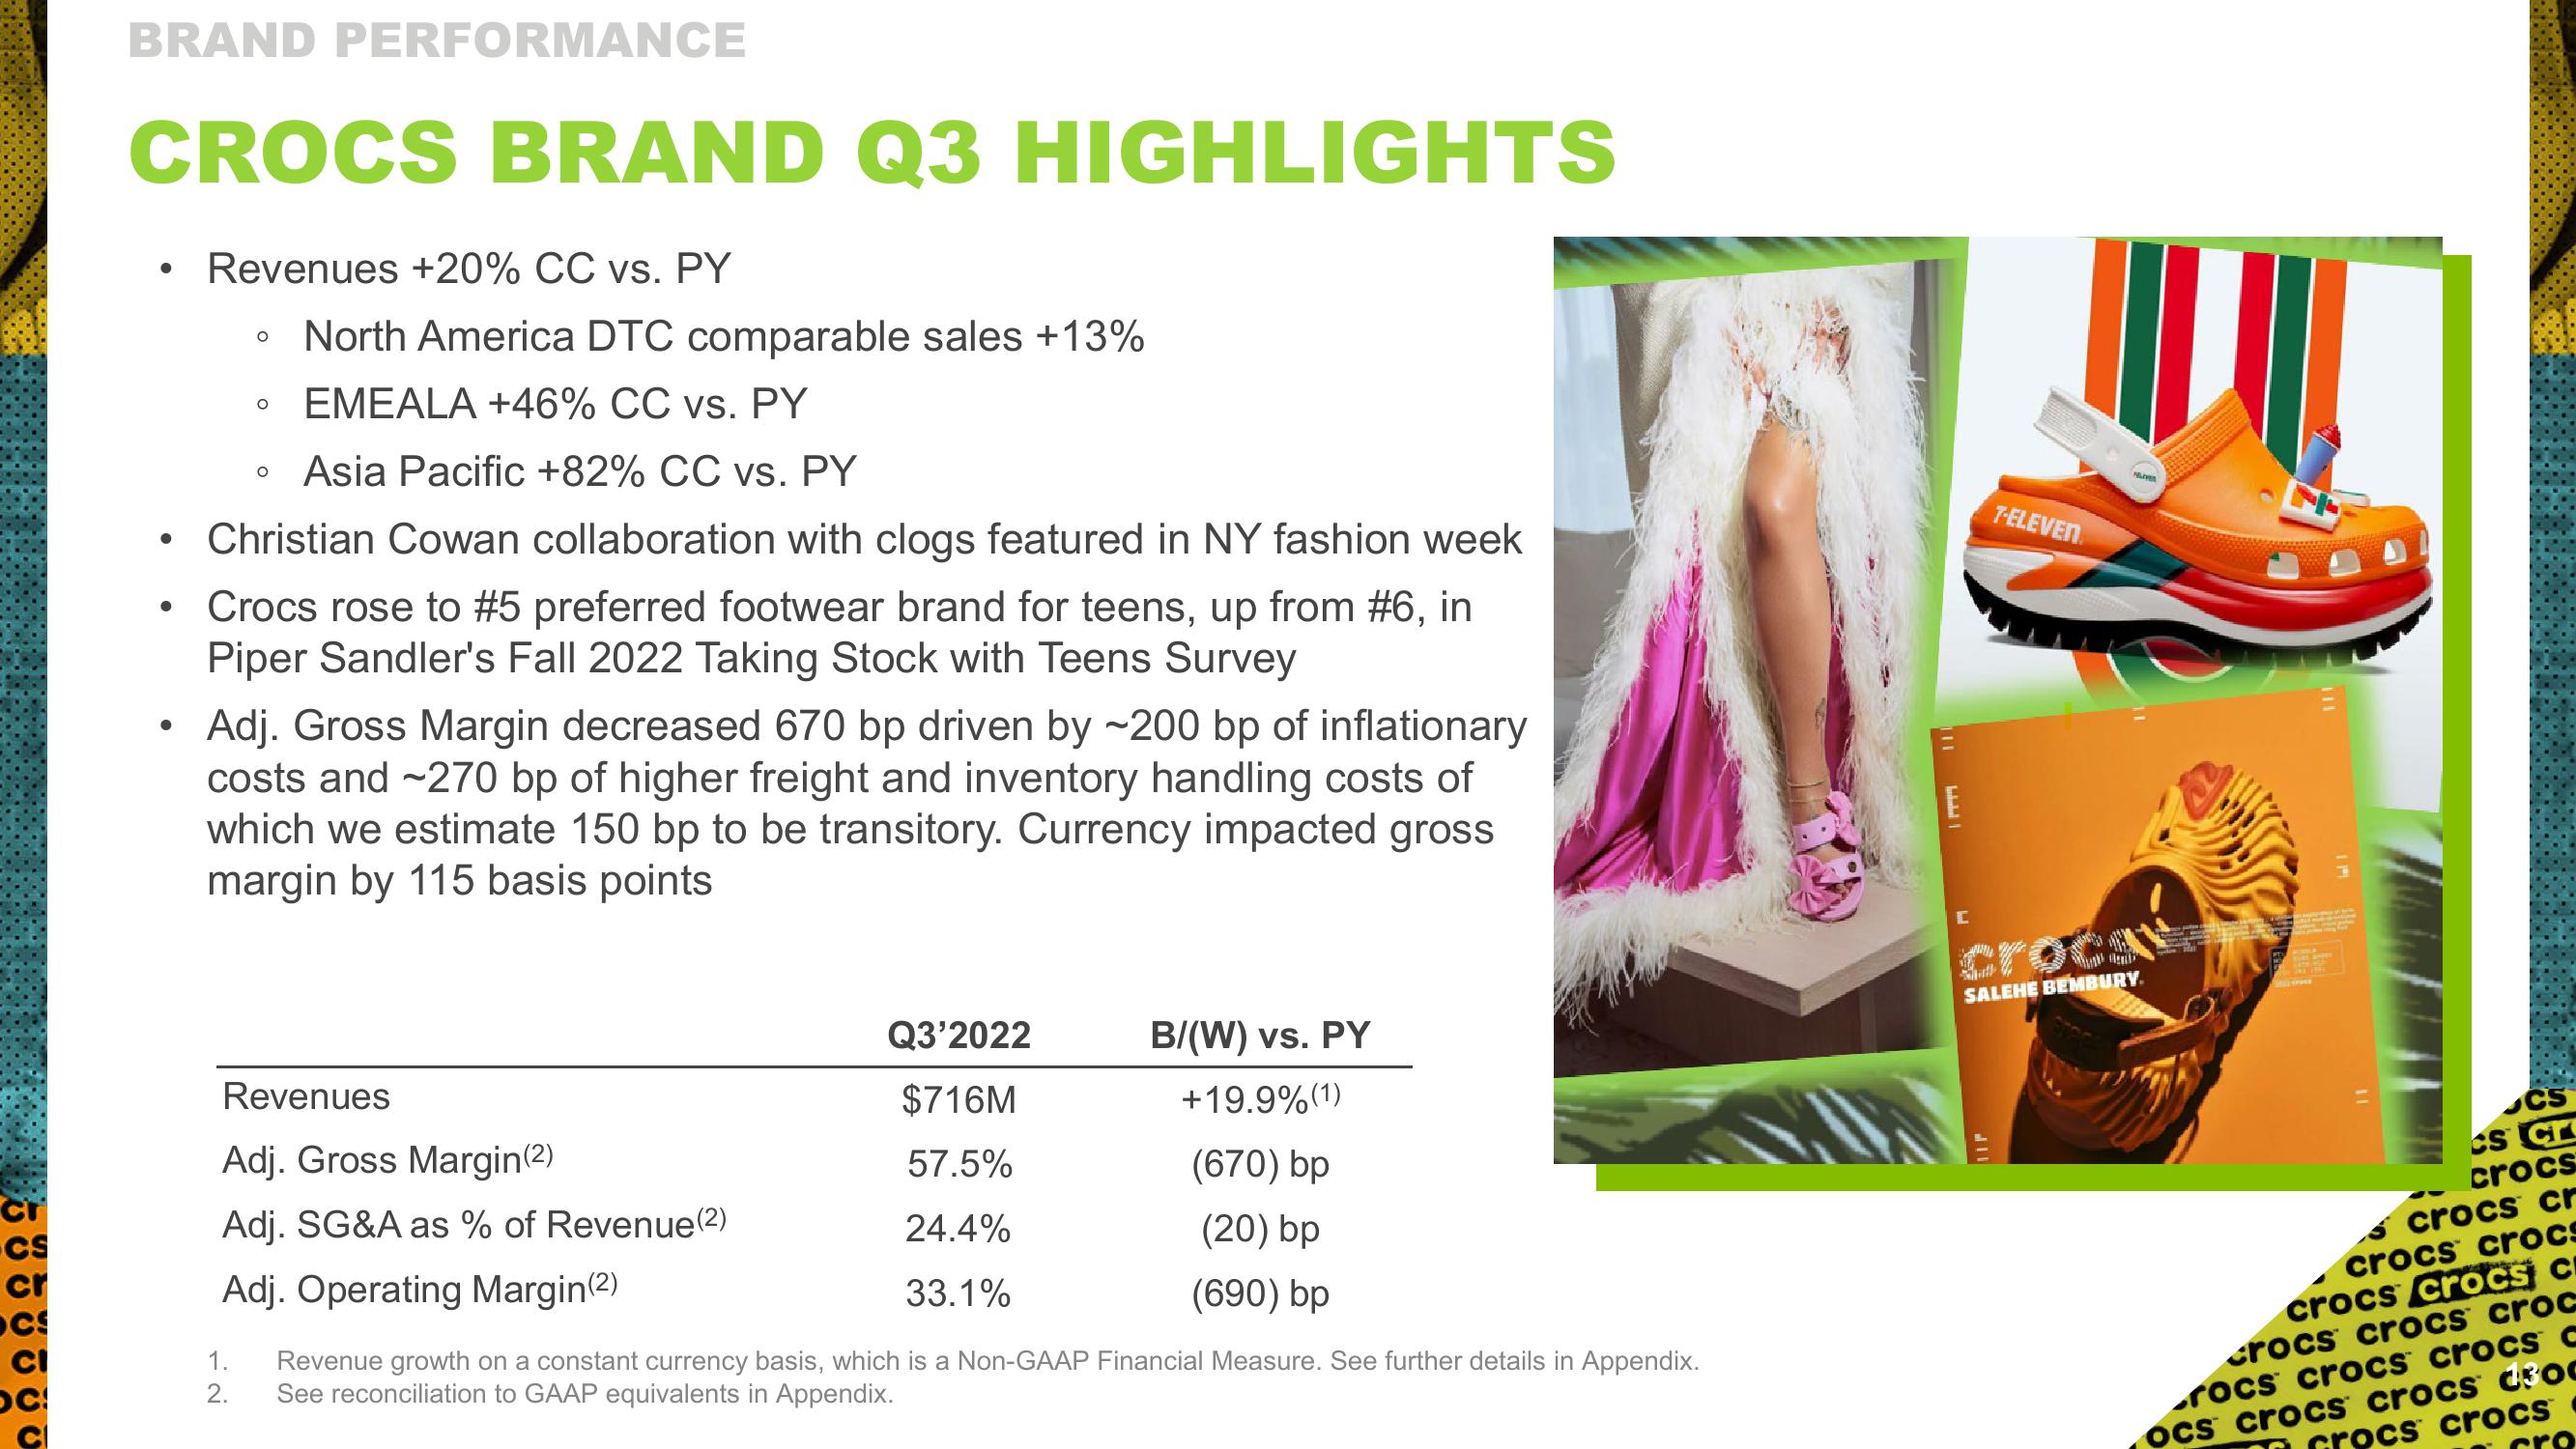
Christian Cowan collaboration with clogs featured in NY fashion week
Crocs rose to #5 preferred footwear brand for teens, up from #6, in
Piper Sandler's Fall 2022 Taking Stock with Teens Survey
1.
2.
O
Adj. Gross Margin decreased 670 bp driven by ~200 bp of inflationary
costs and ~270 bp of higher freight and inventory handling costs of
which we estimate 150 bp to be transitory. Currency impacted gross
margin by 115 basis points
Revenues
Adj. Gross Margin(2)
Adj. SG&A as % of Revenue (2)
Adj. Operating Margin(2)
Q3'2022
$716M
57.5%
24.4%
33.1%
B/(W) vs. PY
+19.9% (1)
(670) bp
(20) bp
(690) bp
Revenue growth on a constant currency basis, which is a Non-GAAP Financial Measure. See further details in Appendix.
See reconciliation to GAAP equivalents in Appendix.
E
C
7-ELEVEN
HAVER
SALEHE BEMBURY.
P
CS
CS Cr
crocs
crocs cr
crocs crocs
crocs crocs C
crocs crocs croc
rocs crocs crocs c
ocs crocs crocs deoc
Grocs crocsView entire presentation