AstraZeneca Results Presentation Deck
Total Revenue
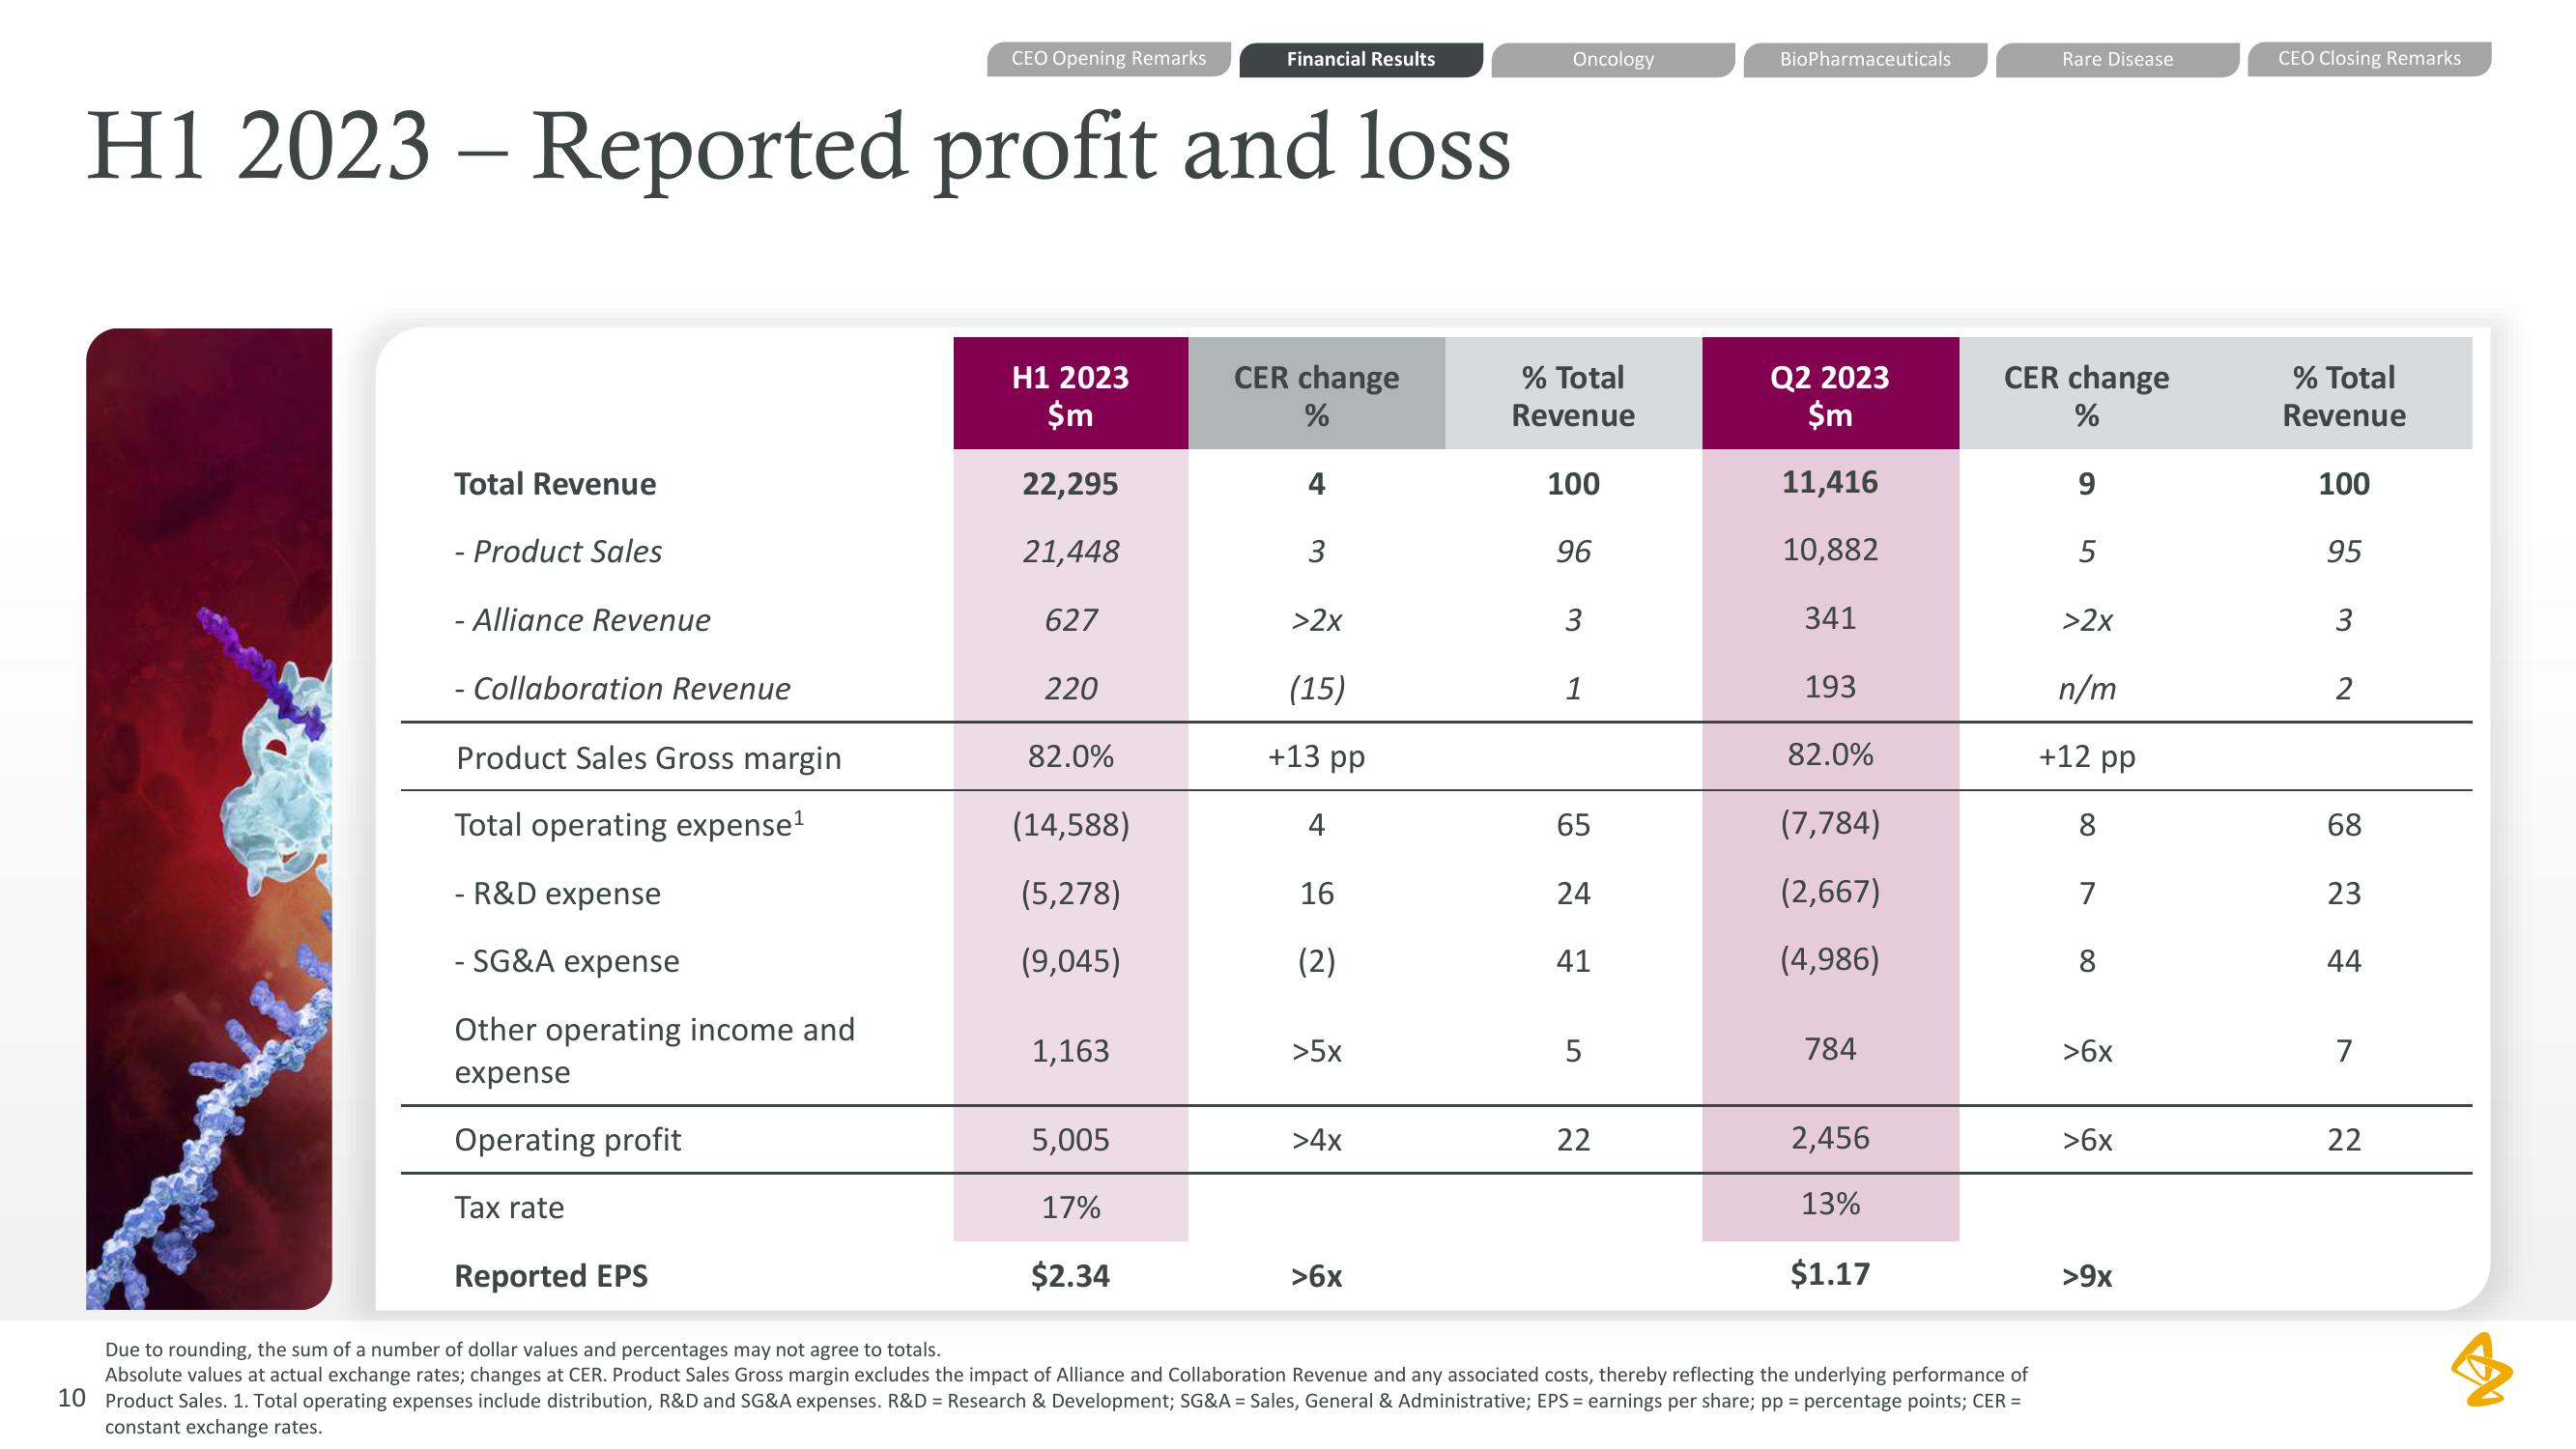
H1 2023 - Reported profit and loss
- Product Sales
- Alliance Revenue
- Collaboration Revenue
Product Sales Gross margin
Total operating expense¹
- R&D expense
- SG&A expense
Other operating income and
expense
Operating profit
Tax rate
CEO Opening Remarks
Reported EPS
H1 2023
$m
22,295
21,448
627
220
82.0%
(14,588)
(5,278)
(9,045)
1,163
Financial Results
5,005
17%
$2.34
CER change
%
3
>2x
(15)
+13 pp
4
16
(2)
>5x
>4x
>6x
Oncology
% Total
Revenue
100
96
3
1
65
24
41
5
22
BioPharmaceuticals
Q2 2023
$m
11,416
10,882
341
193
82.0%
(7,784)
(2,667)
(4,986)
784
2,456
13%
$1.17
Rare Disease
CER change
%
9
Due to rounding, the sum of a number of dollar values and percentages may not agree to totals.
Absolute values at actual exchange rates; changes at CER. Product Sales Gross margin excludes the impact of Alliance and Collaboration Revenue and any associated costs, thereby reflecting the underlying performance of
10 Product Sales. 1. Total operating expenses include distribution, R&D and SG&A expenses. R&D = Research & Development; SG&A = Sales, General & Administrative; EPS = earnings per share; pp = percentage points; CER =
constant exchange rates.
5
>2x
n/m
+12 pp
8
7
8
>6x
>6x
>9x
CEO Closing Remarks
% Total
Revenue
100
95
3
2
68
23
44
7
22
4View entire presentation