Energy Vault SPAC Presentation Deck
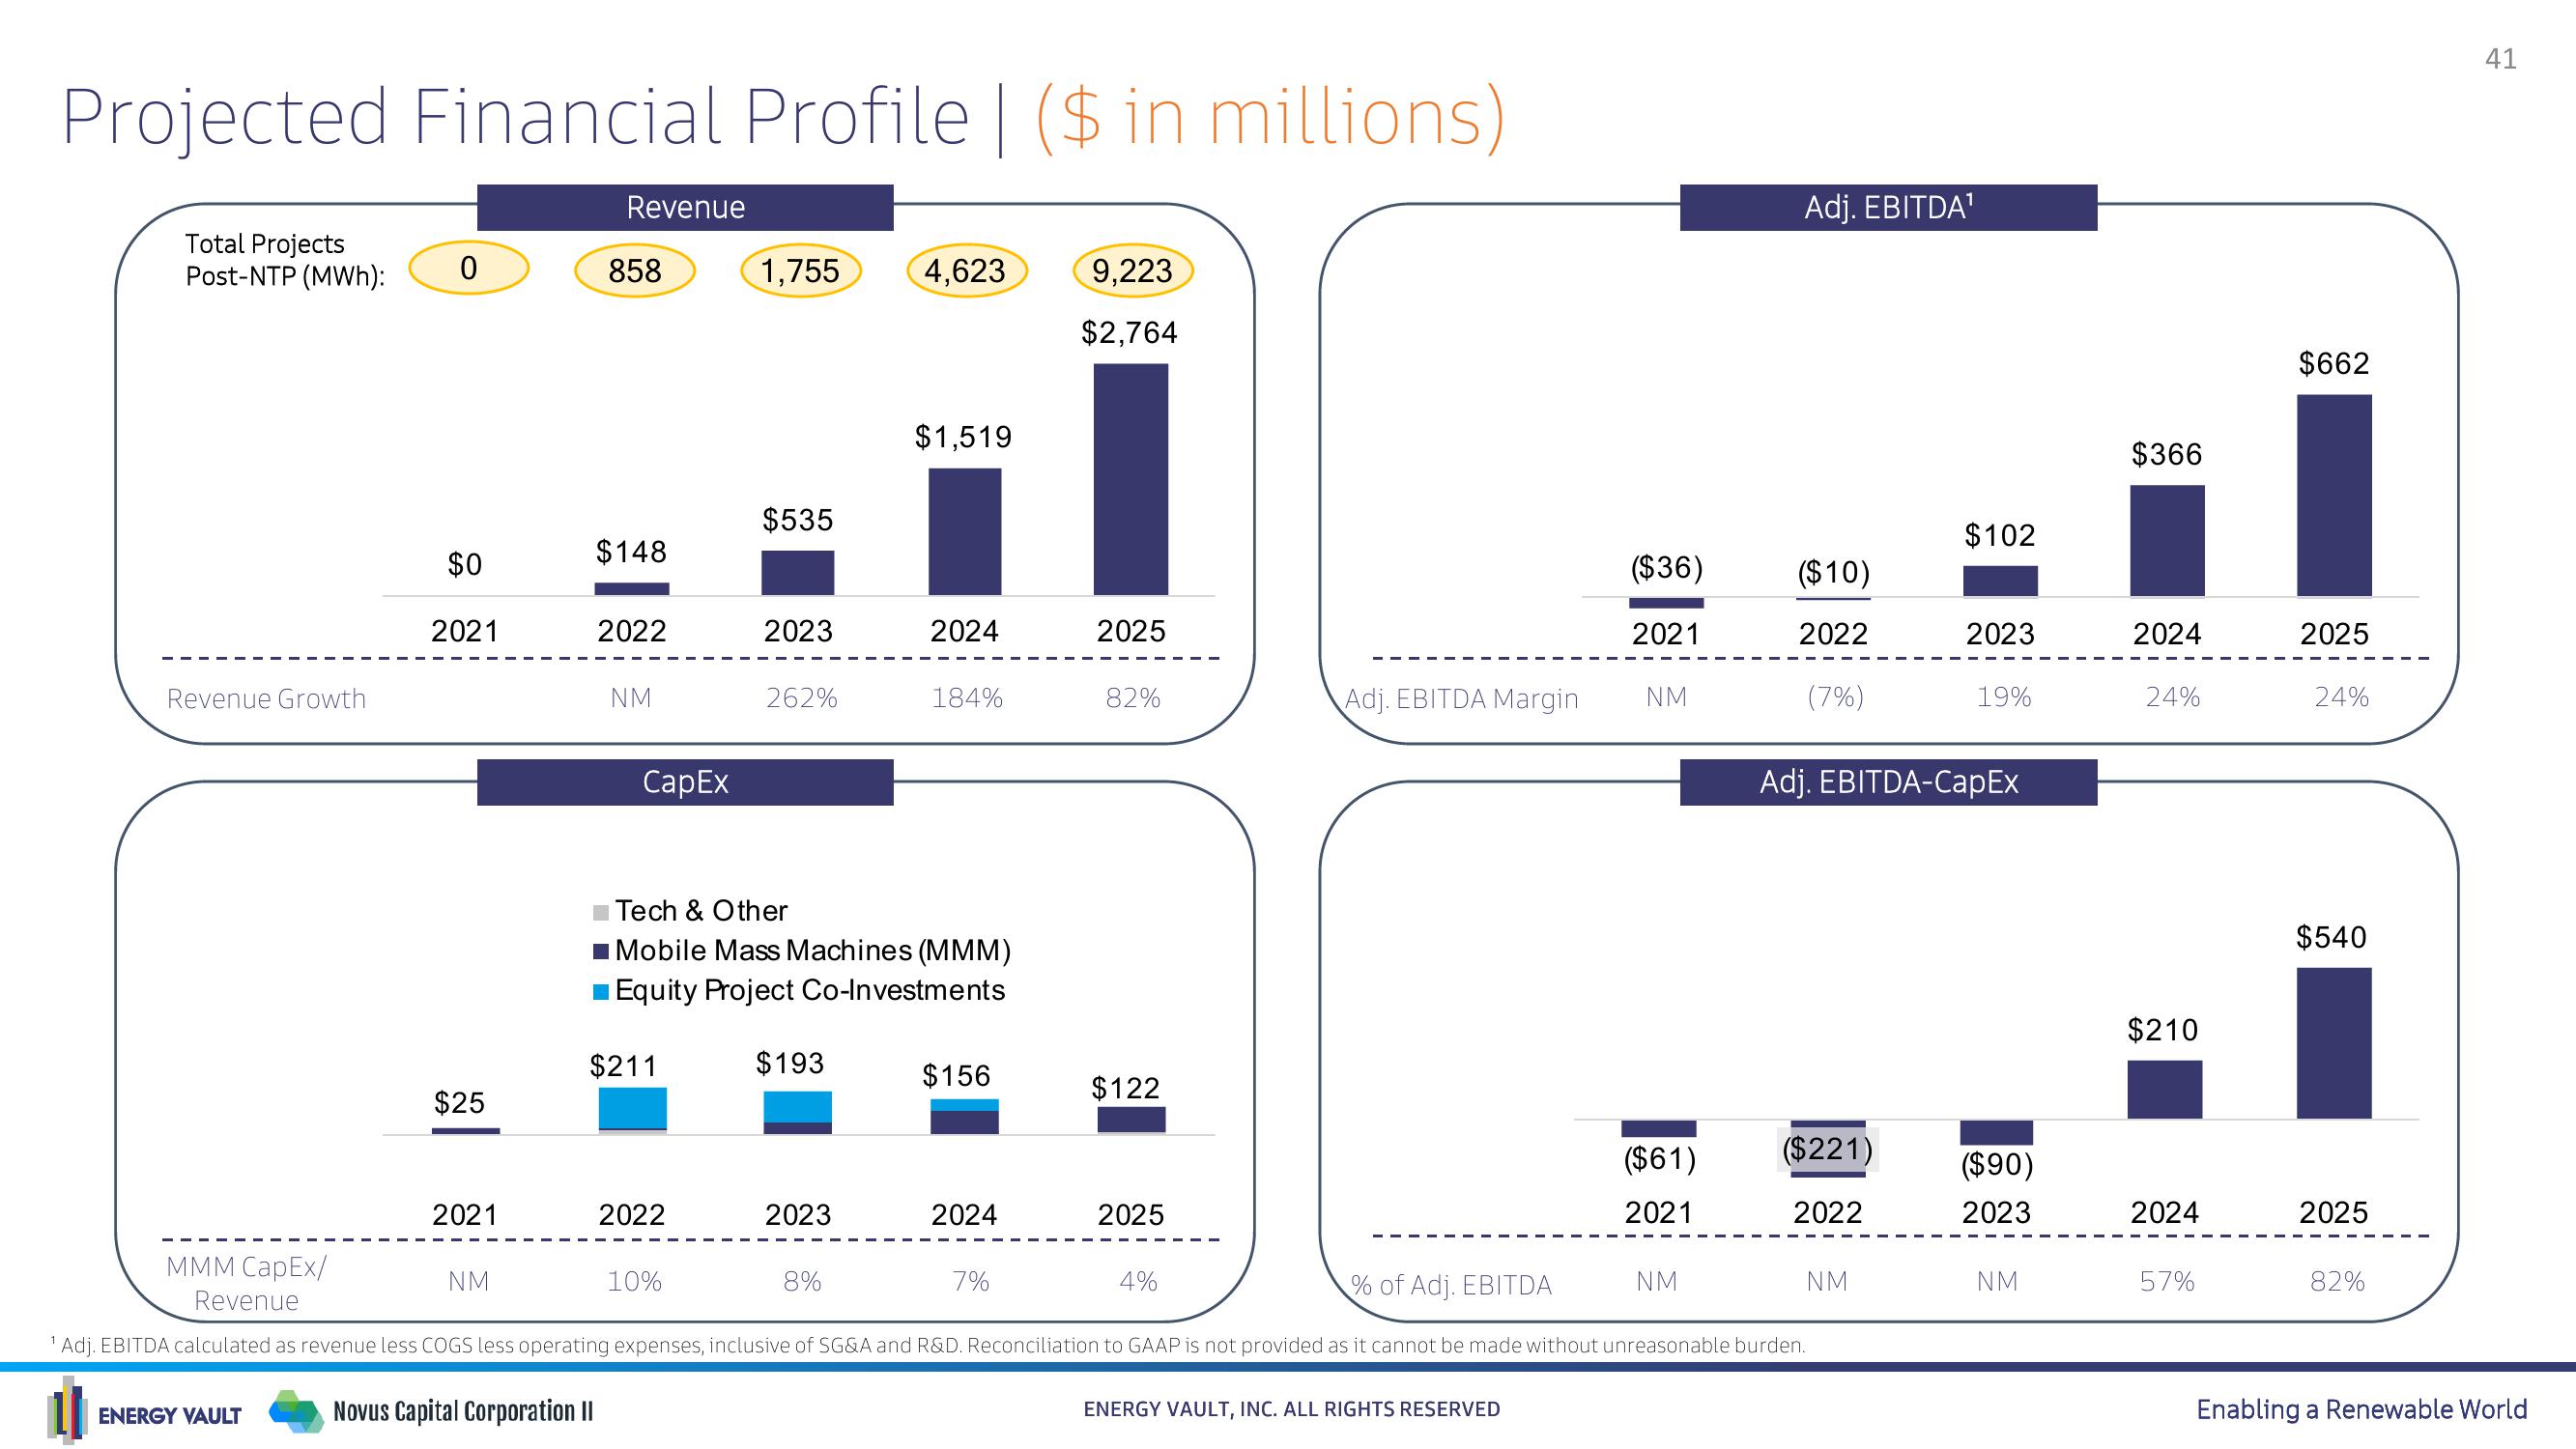
Projected Financial Profile | ($ in millions)
Total Projects
Post-NTP (MWh):
Revenue Growth
-
0
ENERGY VAULT
$0
2021
$25
2021
NM
Revenue
858
$148
2022
Novus Capital Corporation II
NM
CapEx
$211
2022
1,755
$535
10%
2023
262%
Tech & Other
■Mobile Mass Machines (MMM)
Equity Project Co-Investments
$193
2023
4,623
$1,519
8%
2024
184%
$156
2024
9,223
$2,764
7%
2025
82%
$122
2025
Adj. EBITDA Margin
4%
MMM CapEx/
% of Adj. EBITDA
Revenue
Adj. EBITDA calculated as revenue less COGS less operating expenses, inclusive of SG&A and R&D. Reconciliation to GAAP is not provided as it cannot be made without unreasonable burden.
($36)
2021
ENERGY VAULT, INC. ALL RIGHTS RESERVED
NM
($61)
2021
Adj. EBITDA¹
NM
($10)
2022
(7%)
($221)
2022
$102
Adj. EBITDA-CapEx
NM
2023
19%
($90)
2023
NM
$366
2024
24%
$210
2024
57%
$662
2025
24%
$540
2025
82%
41
Enabling a Renewable WorldView entire presentation