DraftKings Investor Day Presentation Deck
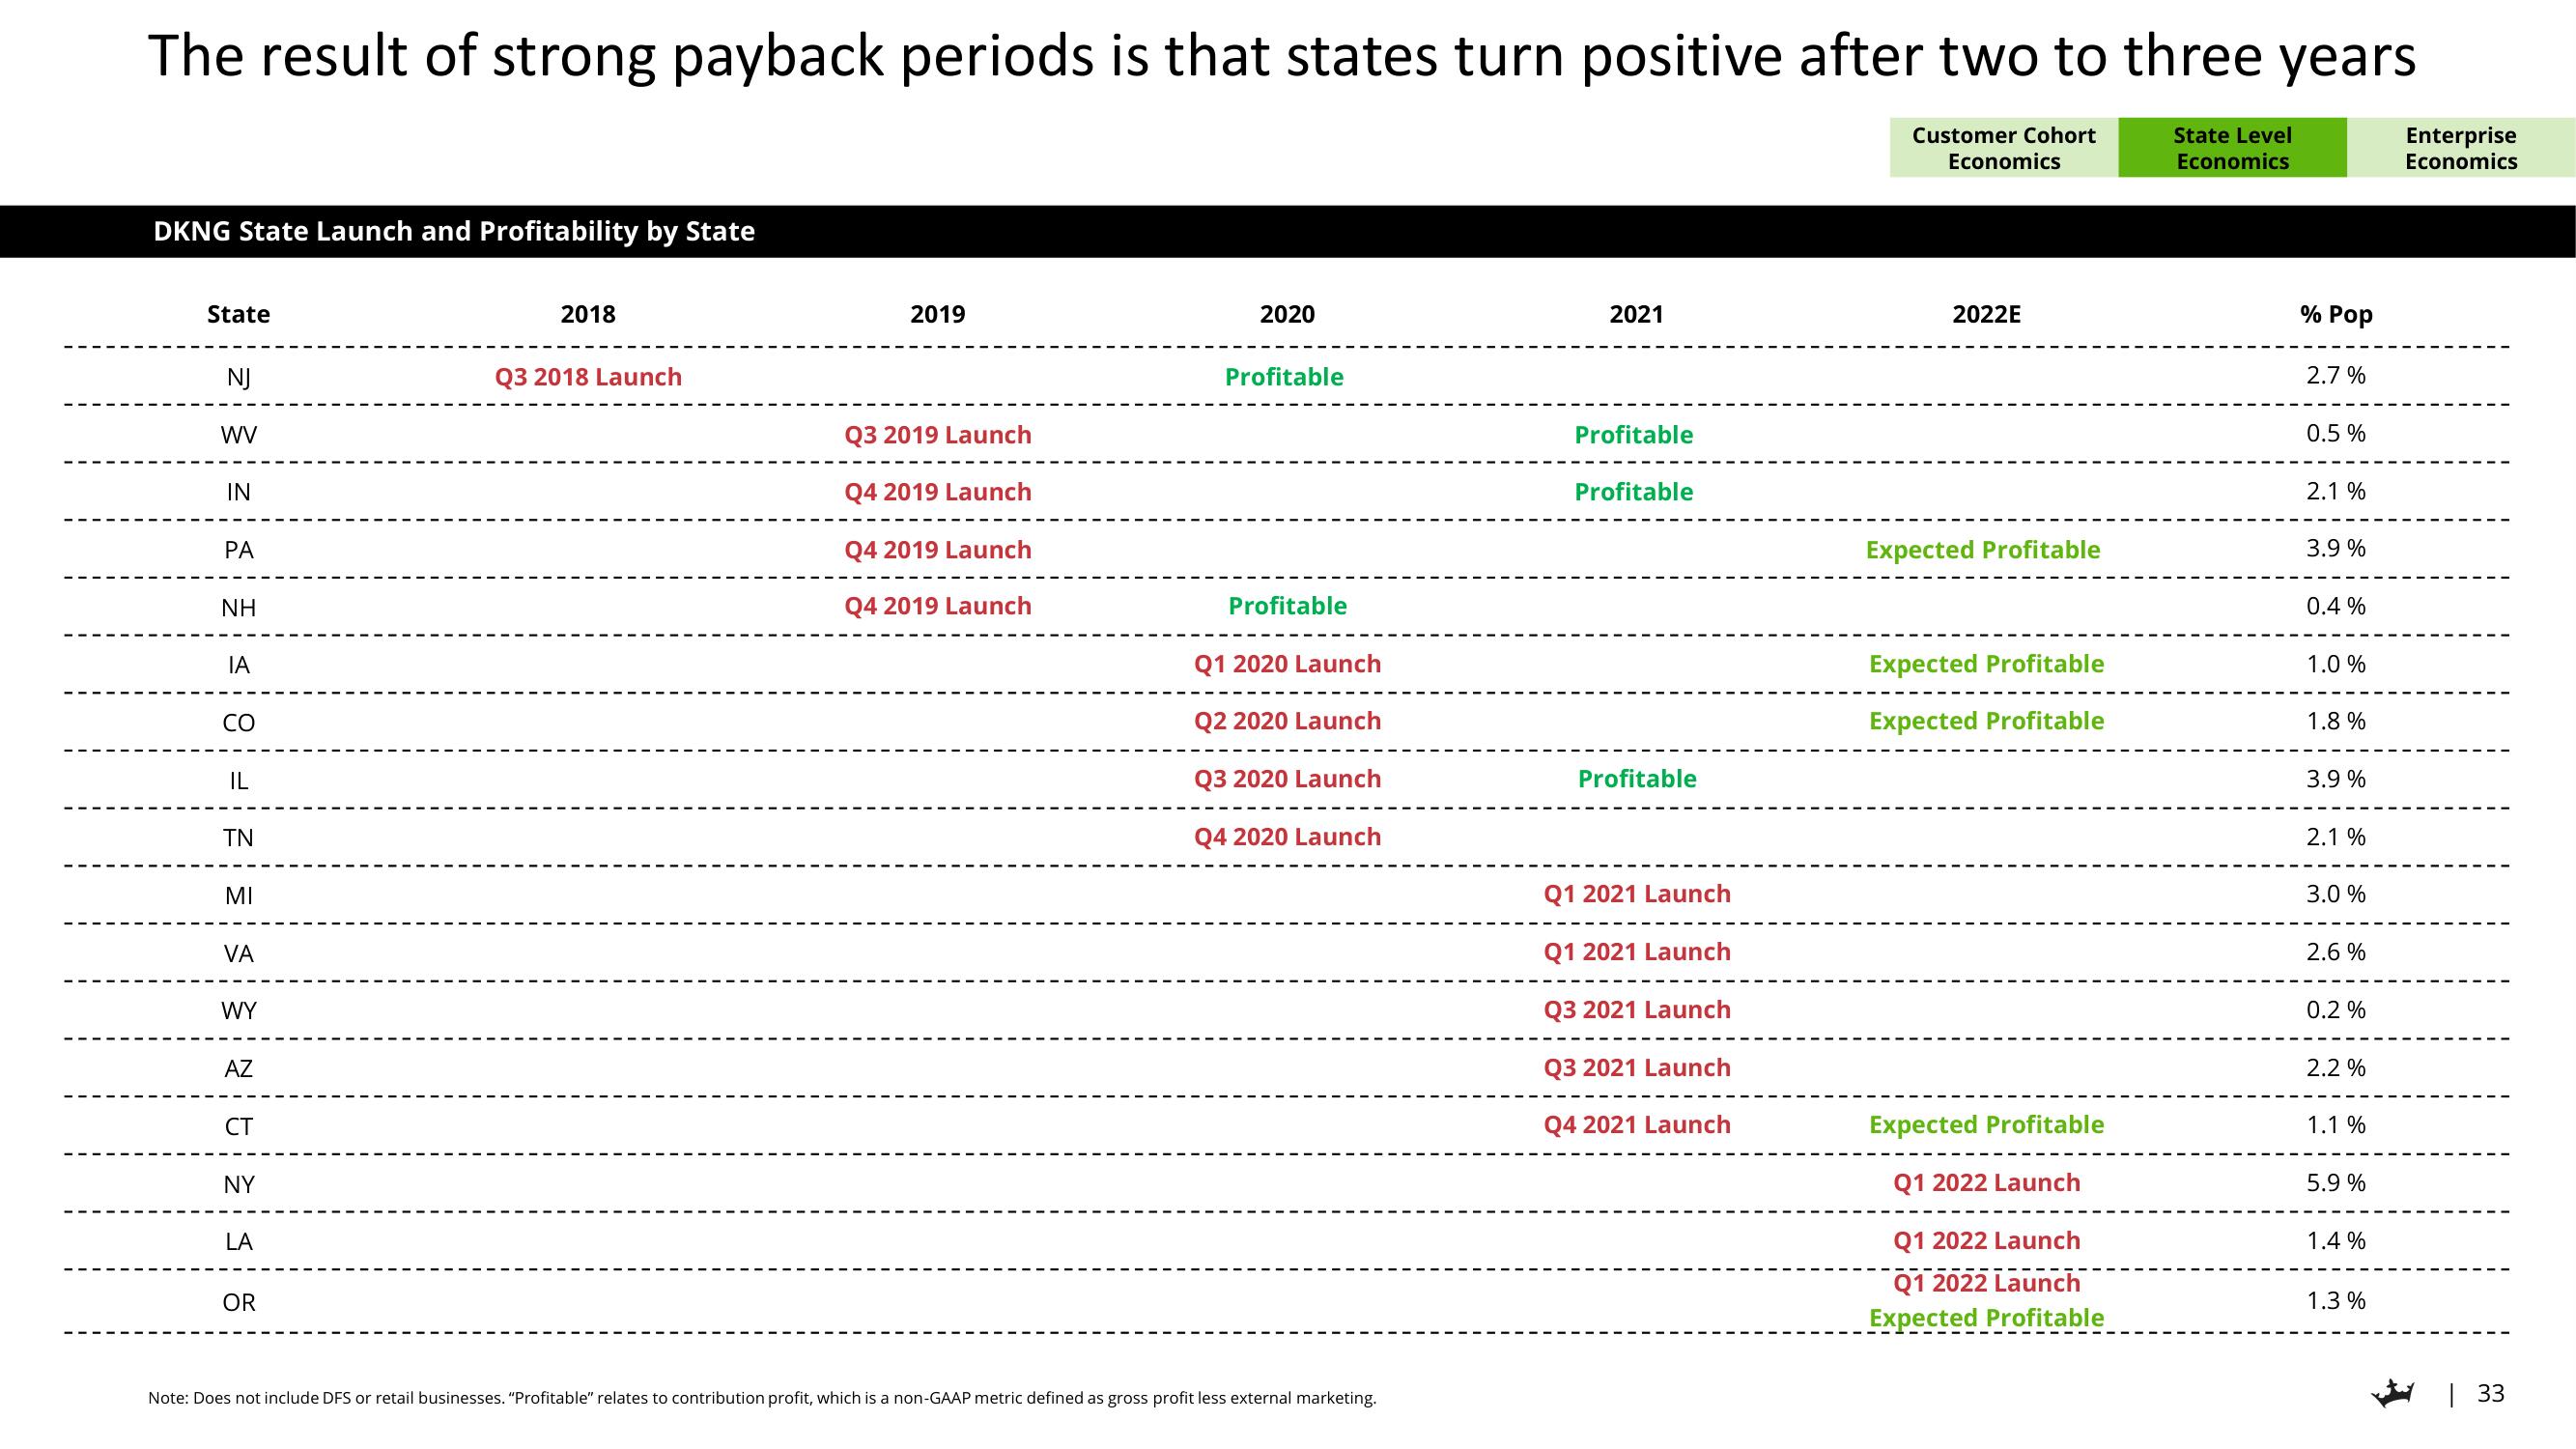
The result of strong payback periods is that states turn positive after two to three years
Customer Cohort
Economics
State Level
Economics
DKNG State Launch and Profitability by State
State
NJ
WV
IN
PA
NH
IA
CO
IL
TN
MI
VA
WY
AZ
CT
NY
LA
OR
2018
Q3 2018 Launch
2019
Q3 2019 Launch
Q4 2019 Launch
Q4 2019 Launch
Q4 2019 Launch
2020
Profitable
Profitable
Q1 2020 Launch
Q2 2020 Launch
Q3 2020 Launch
Q4 2020 Launch
Note: Does not include DFS or retail businesses. "Profitable" relates to contribution profit, which is a non-GAAP metric defined as gross profit less external marketing.
2021
Profitable
Profitable
Profitable
Q1 2021 Launch
Q1 2021 Launch
Q3 2021 Launch
Q3 2021 Launch
Q4 2021 Launch
2022E
Expected Profitable
Expected Profitable
Expected Profitable
Expected Profitable
Q1 2022 Launch
Q1 2022 Launch
Q1 2022 Launch
Expected Profitable
% Pop
2.7%
0.5%
2.1 %
3.9%
0.4 %
1.0%
1.8%
3.9 %
2.1 %
3.0 %
2.6 %
0.2 %
2.2 %
1.1 %
5.9 %
1.4%
1.3 %
Enterprise
Economics
| 33View entire presentation