Main Street Capital Investor Day Presentation Deck
●
Consistent Growth of Private Loan Assets
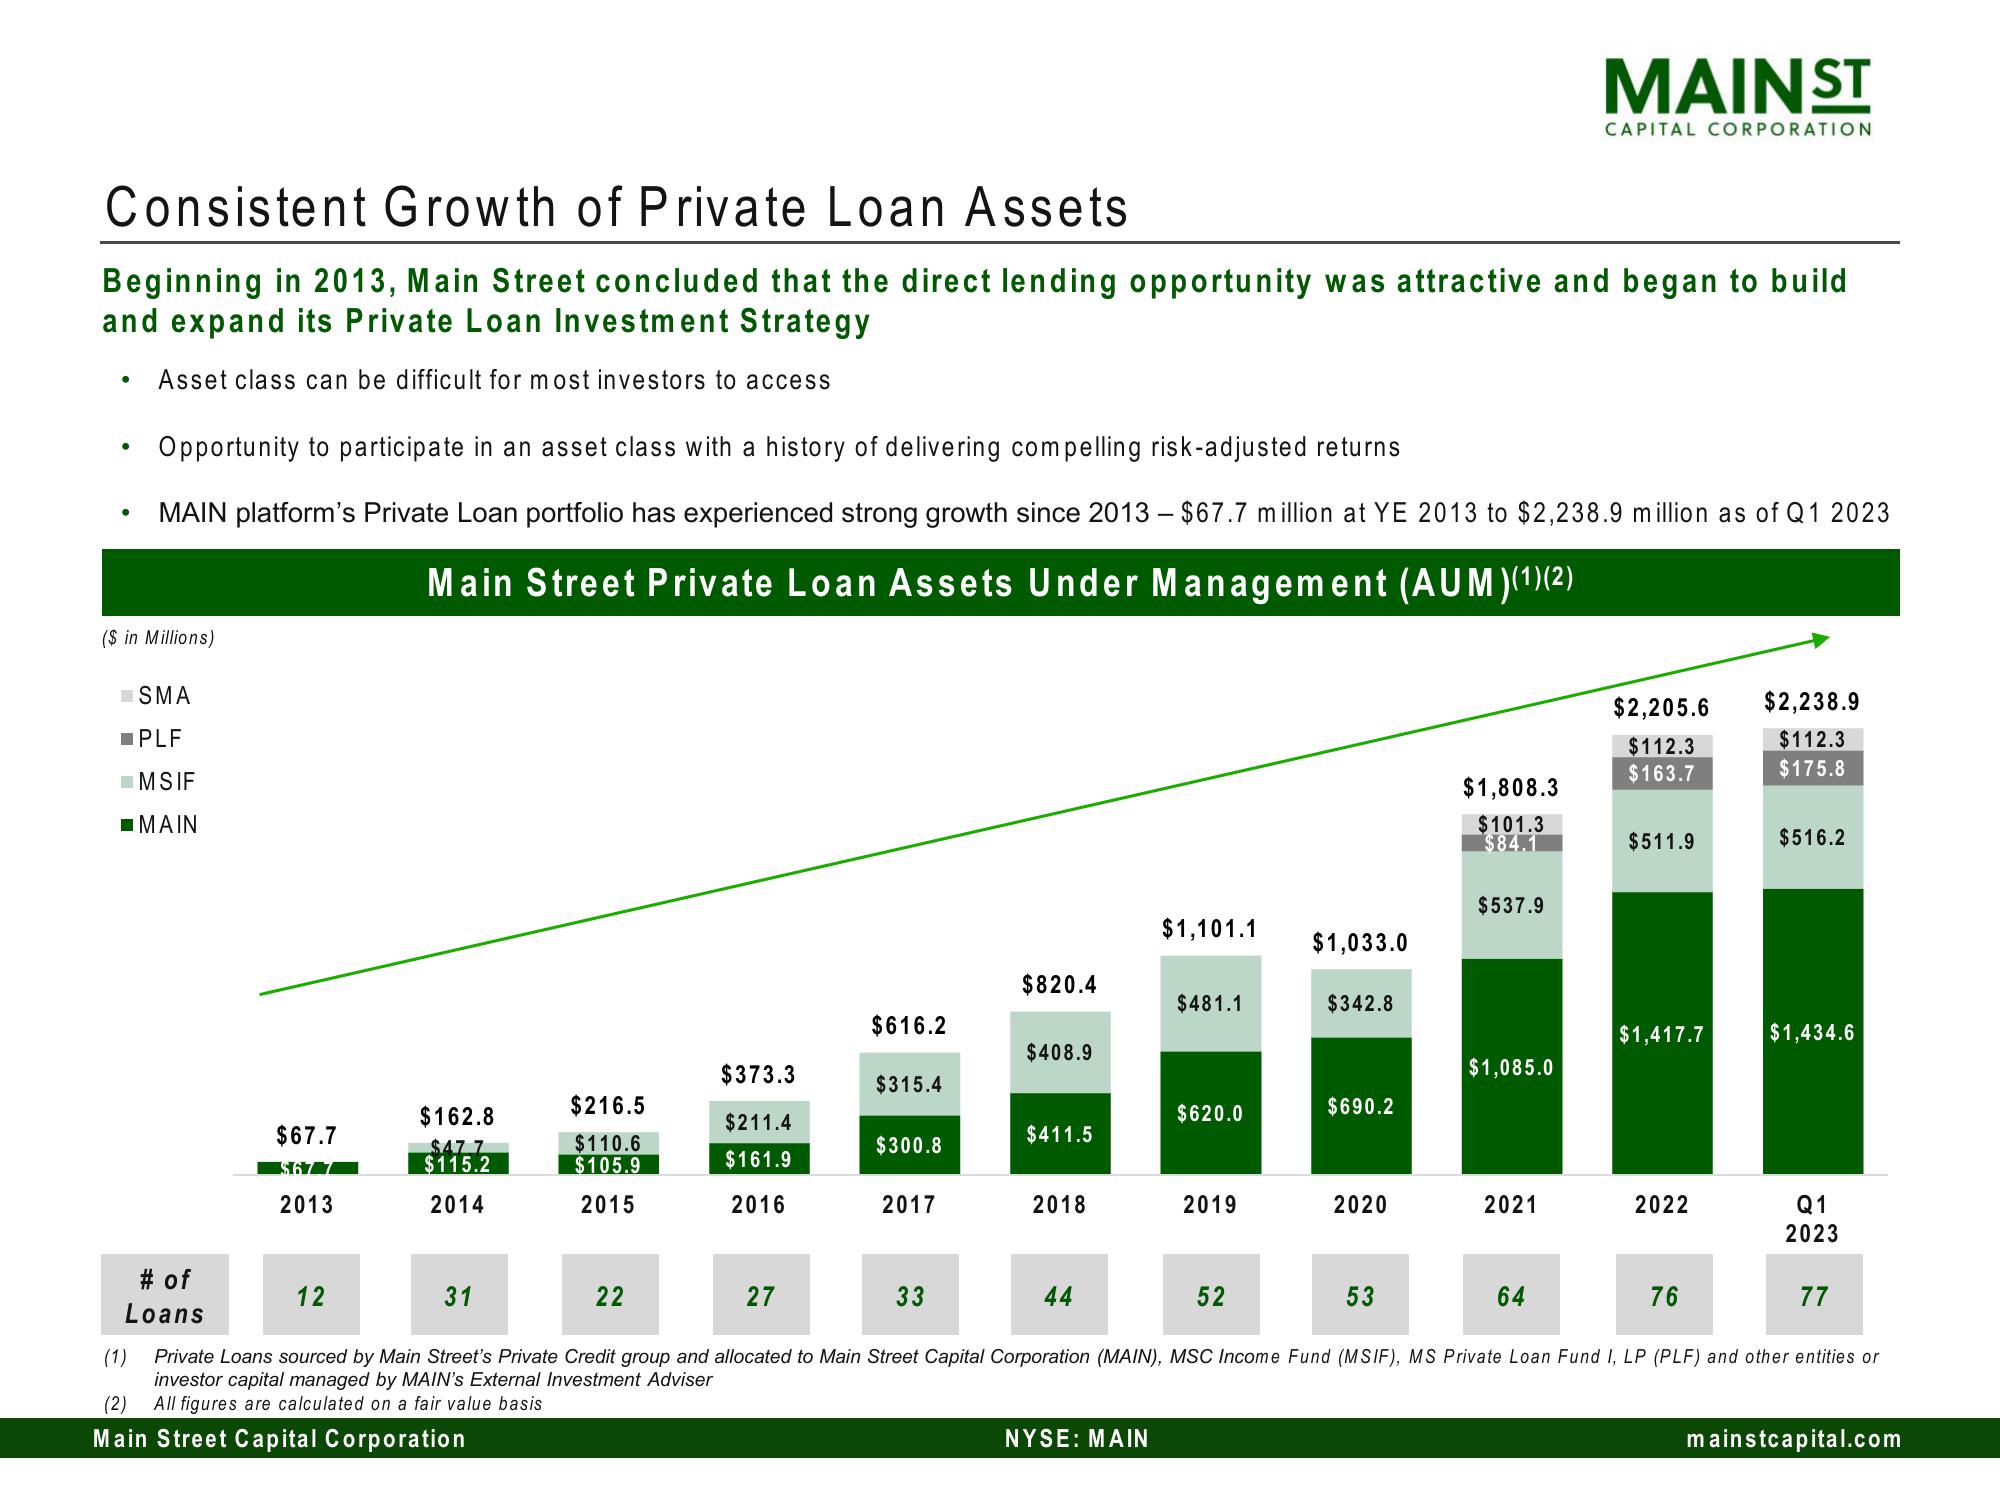
Beginning in 2013, Main Street concluded that the direct lending opportunity was attractive and began to build
and expand its Private Loan Investment Strategy
Asset class can be difficult for most investors to access
●
●
($ in Millions)
Opportunity to participate in an asset class with a history of delivering compelling risk-adjusted returns
MAIN platform's Private Loan portfolio has experienced strong growth since 2013 - $67.7 million at YE 2013 to $2,238.9 million as of Q1 2023
Main Street Private Loan Assets Under Management (AUM)(1)(2)
SMA
■PLF
MSIF
■MAIN
# of
Loans
$67.7
$677
2013
12
$162.8
$477
$115.2
2014
31
$216.5
$110.6
$105.9
2015
22
$373.3
$211.4
$161.9
2016
27
$616.2
$315.4
$300.8
2017
33
$820.4
$408.9
$411.5
2018
44
$1,101.1
NYSE: MAIN
$481.1
$620.0
2019
52
$1,033.0
$342.8
$690.2
2020
53
$1,808.3
$101.3
$84.1
$537.9
$1,085.0
MAIN ST
2021
CAPITAL CORPORATION
64
$2,205.6
$112.3
$163.7
$511.9
$1,417.7
2022
76
$2,238.9
$112.3
$175.8
$516.2
$1,434.6
Q1
2023
77
(1) Private Loans sourced by Main Street's Private Credit group and allocated to Main Street Capital Corporation (MAIN), MSC Income Fund (MSIF), MS Private Loan Fund I, LP (PLF) and other entities or
investor capital managed by MAIN's External Investment Adviser
(2) All figures are calculated on a fair value basis
Main Street Capital Corporation
mainstcapital.comView entire presentation