Cameco IPO Presentation Deck
Historical Non-GAAP and Non-IFRS
Reconciliations
Westinghouse Adjusted EBITDA and Adjusted Free Cash Flow Reconciliation (US$M)
Proportionate
Share (49%)
LTM ended
LTM ended
June 30, 2022 June 30, 2022
559
Net income
Depreciation & Amortization
Interest costs (net, including accretion)
Income tax (recovery)
Restructuring and acquisition related expenses
Gain (loss) on disposal of fixed assets
Non-operating income
Impact of derivative instruments
Other non-operating items
Adjusted EBITDA
Capital expenditures
Adjusted Free Cash Flow
Adjusted EBITDA margin (Adj. EBITDA/Revenue)
Adjusted Free Cash Flow margin (Adj. FCF/Adj. EBITDA)
2019
26
284
243
(6)
97
(9)
(36)
0
13
613
138
475
18%
78%
2020
42
289
221
15
70
5
(3)
(20)
28
646
133
513
20%
79%
2021
126
303
186
(17)
67
7
0
2
21
695
154
541
21%
78%
299
183
(433)
89
(1)
(1)
12
(7)
701
145
556
21%
79%
344
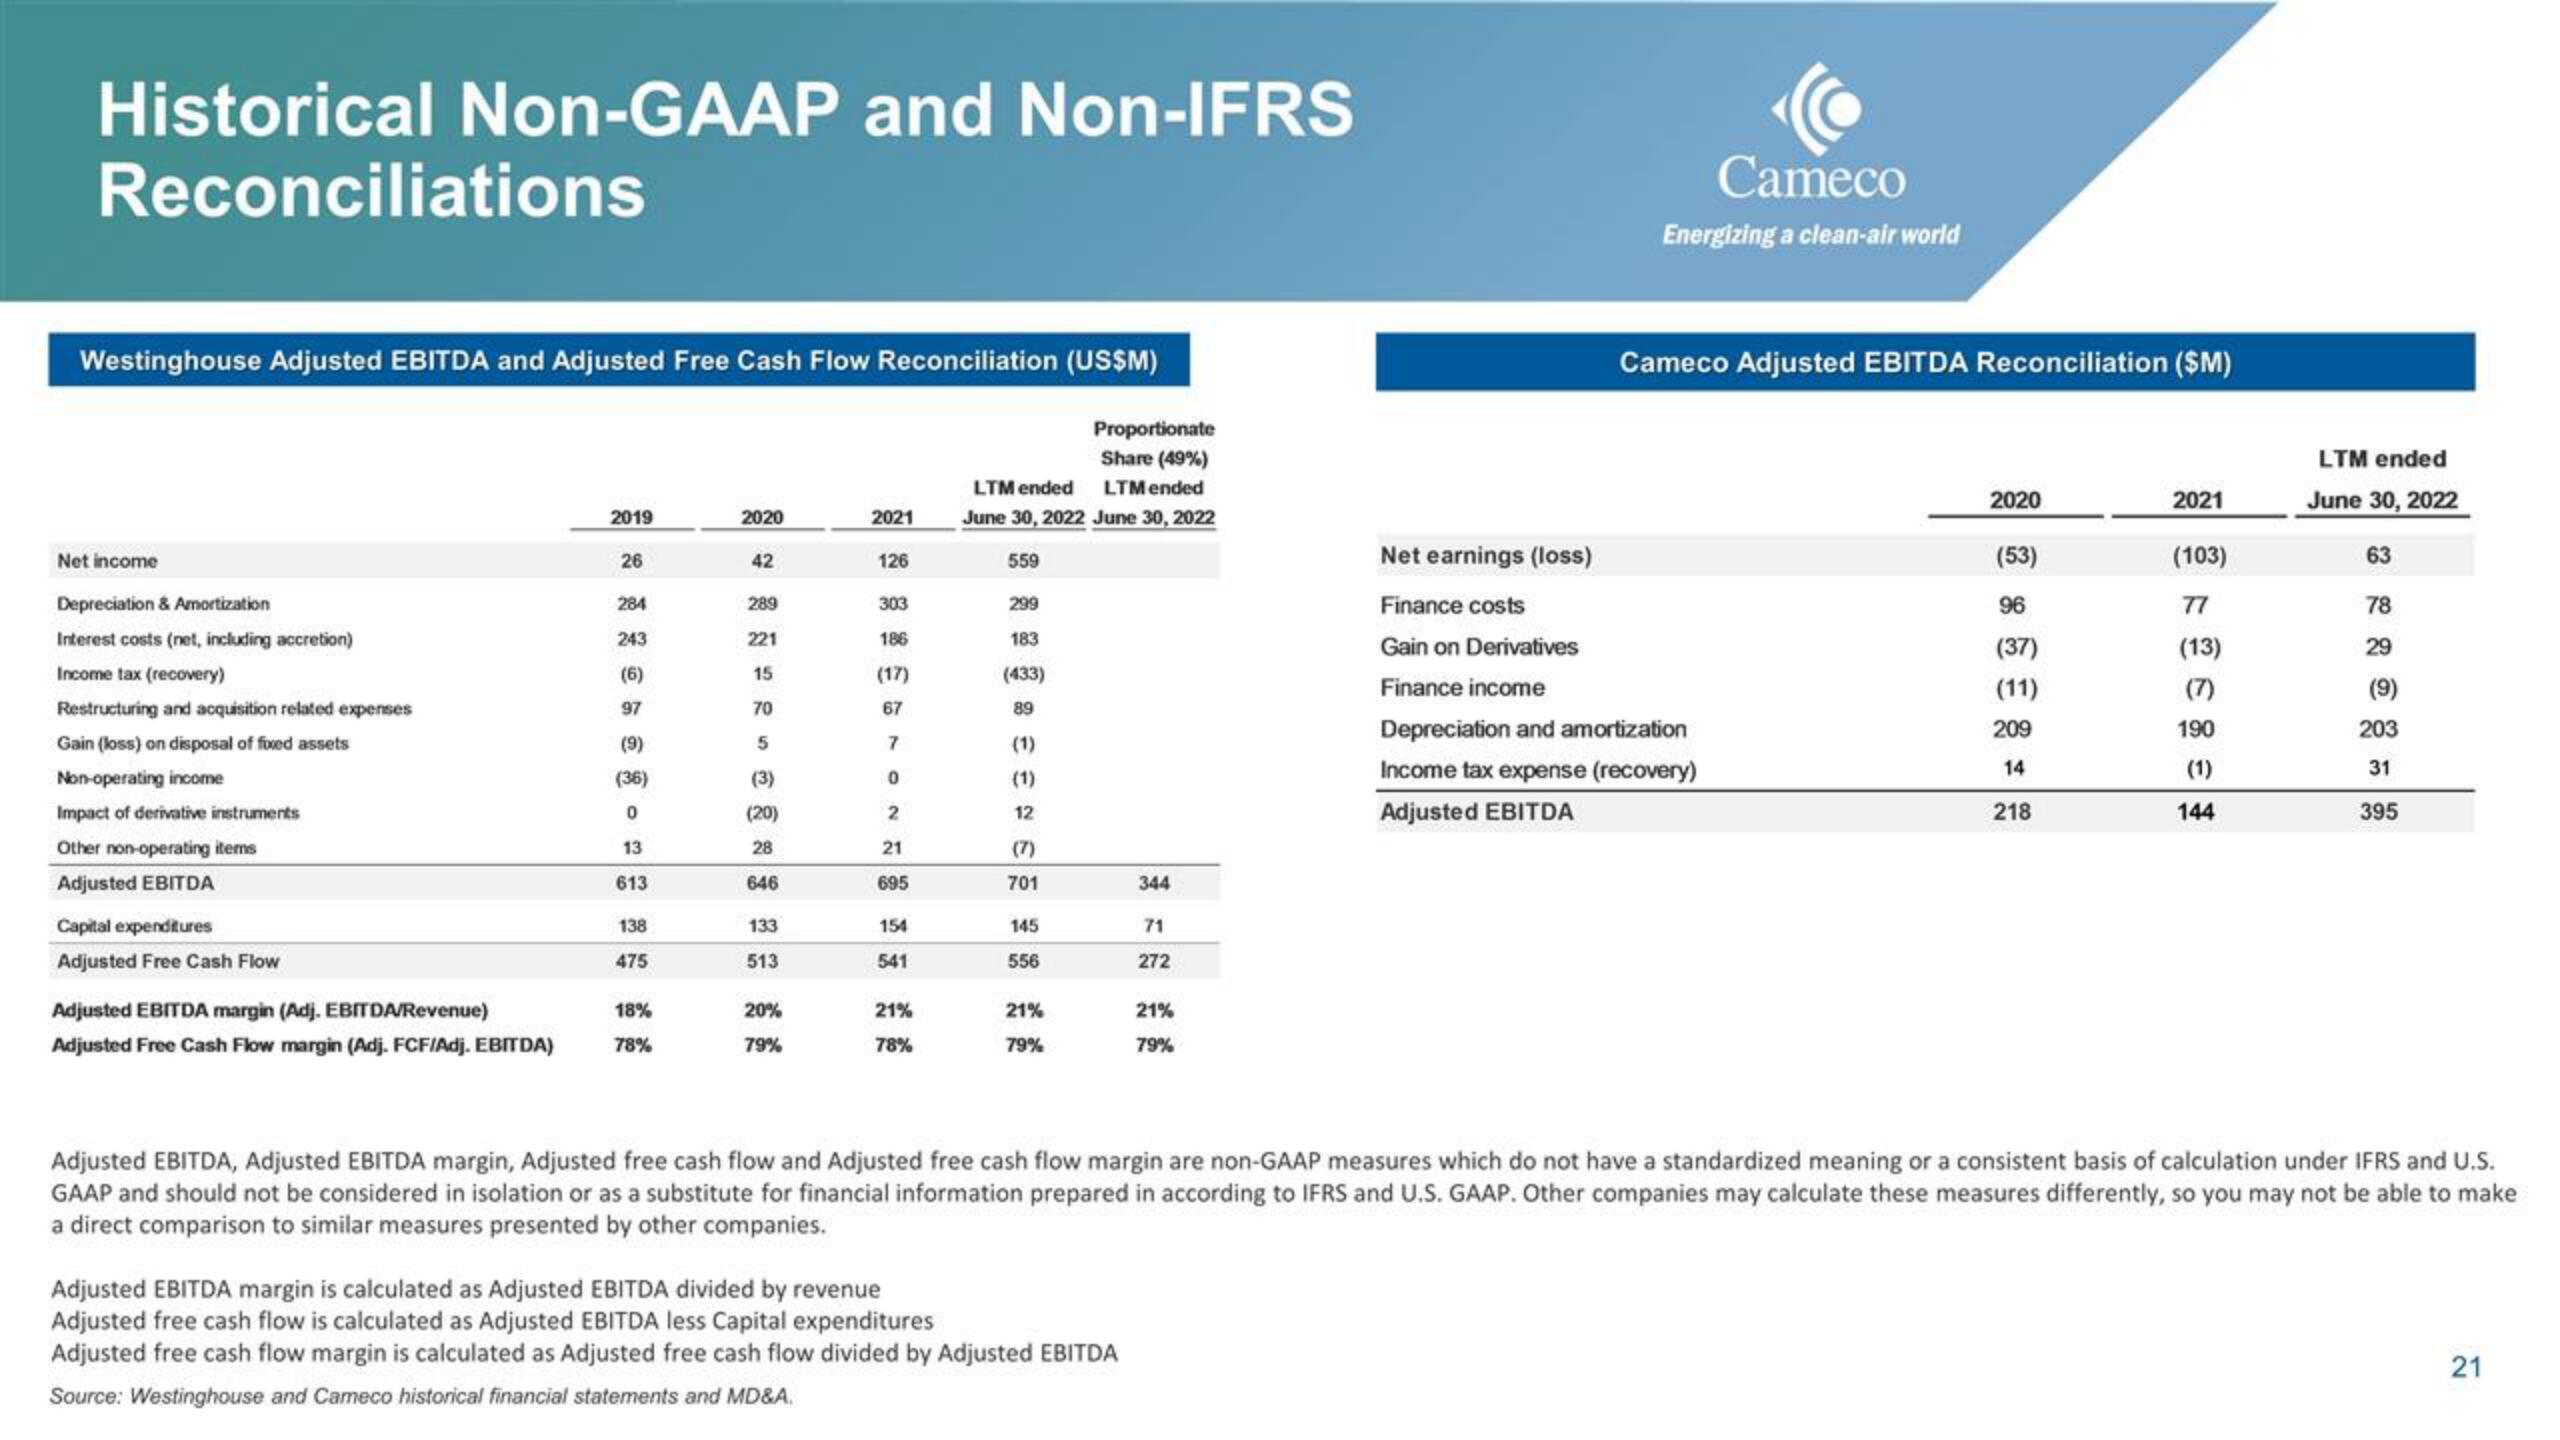
Adjusted EBITDA margin is calculated as Adjusted EBITDA divided by revenue
Adjusted free cash flow is calculated as Adjusted EBITDA less Capital expenditures
Adjusted free cash flow margin is calculated as Adjusted free cash flow divided by Adjusted EBITDA
Source: Westinghouse and Cameco historical financial statements and MD&A.
71
272
21%
79%
Net earnings (loss)
Finance costs
Gain on Derivatives
Finance income
Cameco
Energizing a clean-air world
Cameco Adjusted EBITDA Reconciliation ($M)
Depreciation and amortization
Income tax expense (recovery)
Adjusted EBITDA
2020
(53)
96
(37)
(11)
209
14
218
2021
(103)
77
(13)
(7)
190
(1)
144
LTM ended
June 30, 2022
63
78
29
(9)
203
31
395
Adjusted EBITDA, Adjusted EBITDA margin, Adjusted free cash flow and Adjusted free cash flow margin are non-GAAP measures which do not have a standardized meaning or a consistent basis of calculation under IFRS and U.S.
GAAP and should not be considered in isolation or as a substitute for financial information prepared in according to IFRS and U.S. GAAP. Other companies may calculate these measures differently, so you may not be able to make
a direct comparison to similar measures presented by other companies.
21View entire presentation