J.P.Morgan 2Q23 Investor Results
JPMORGAN CHASE & CO.
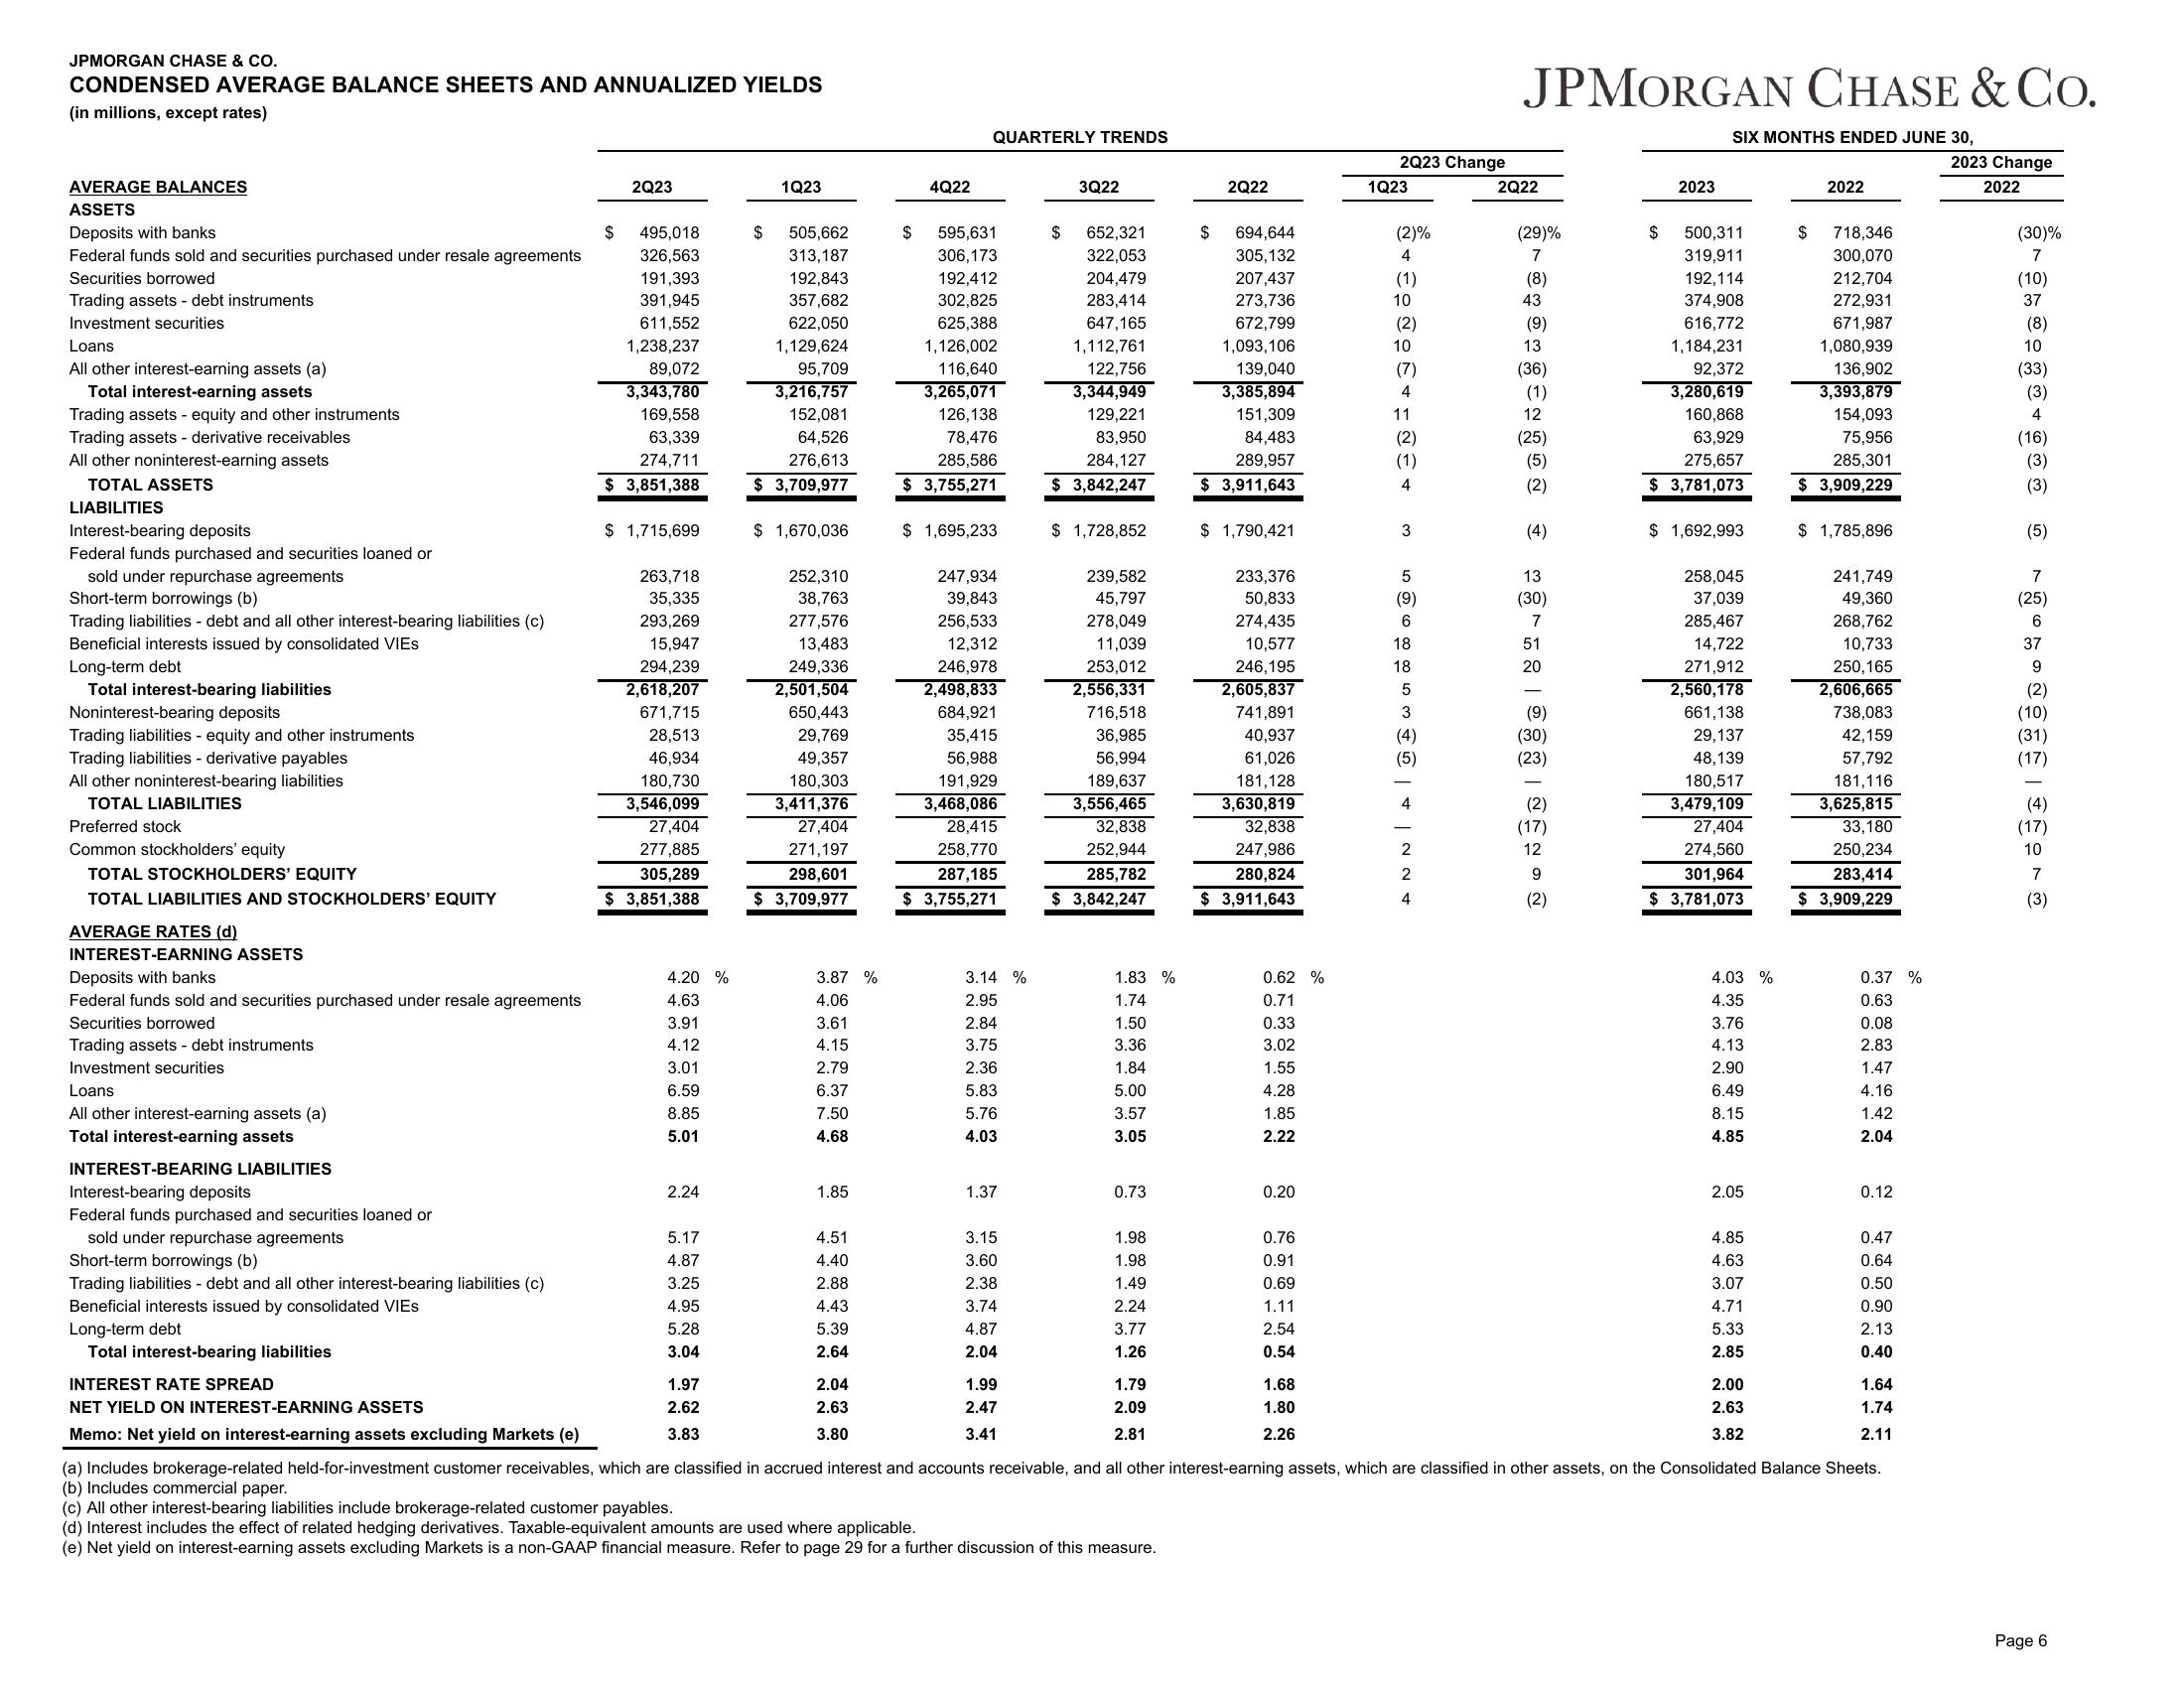
CONDENSED AVERAGE BALANCE SHEETS AND ANNUALIZED YIELDS
(in millions, except rates)
AVERAGE BALANCES
ASSETS
Deposits with banks
Federal funds sold and securities purchased under resale agreements
Securities borrowed
Trading assets - debt instruments
Investment securities
Loans
All other interest-earning assets (a)
Total interest-earning assets
Trading assets - equity and other instruments
Trading assets - derivative receivables
All other noninterest-earning assets
TOTAL ASSETS
LIABILITIES
Interest-bearing deposits
Federal funds purchased and securities loaned or
sold under repurchase agreements
Short-term borrowings (b)
Trading liabilities - debt and all other interest-bearing liabilities (c)
Beneficial interests issued by consolidated VIES
Long-term debt
Total interest-bearing liabilities
Noninterest-bearing deposits
Trading liabilities - equity and other instruments
Trading liabilities - derivative payables
All other noninterest-bearing liabilities
TOTAL LIABILITIES
Preferred stock
Common stockholders' equity
TOTAL STOCKHOLDERS' EQUITY
TOTAL LIABILITIES AND STOCKHOLDERS' EQUITY
AVERAGE RATES (d)
INTEREST-EARNING ASSETS
Deposits with banks
Federal funds sold and securities purchased under resale agreements
Securities borrowed
Trading assets - debt instruments
Investment securities
Loans
All other interest-earning assets (a)
Total interest-earning assets
INTEREST-BEARING LIABILITIES
Interest-bearing deposits
Federal funds purchased and securities loaned or
sold under repurchase agreements
Short-term borrowings (b)
Trading liabilities - debt and all other interest-bearing liabilities (c)
Beneficial interests issued by consolidated VIES
Long-term debt
Total interest-bearing liabilities
INTEREST RATE SPREAD
NET YIELD ON INTEREST-EARNING ASSETS
Memo: Net yield on interest-earning assets excluding Markets (e)
$
2Q23
495,018
326,563
191,393
391,945
611,552
1,238,237
89,072
3,343,780
169,558
63,339
274,711
$ 3,851,388
$ 1,715,699
263,718
35,335
293,269
15,947
294,239
2,618,207
671,715
28,513
46,934
180,730
3,546,099
27,404
277,885
305,289
$ 3,851,388
4.20 %
4.63
3.91
4.12
3.01
6.59
8.85
5.01
2.24
5.17
4.87
3.25
4.95
5.28
3.04
1.97
2.62
3.83
$
1Q23
505,662
313,187
192,843
357,682
622,050
1,129,624
95,709
3,216,757
152,081
64,526
276,613
$ 3,709,977
$ 1,670,036
252,310
38,763
277,576
13,483
249,336
2,501,504
650,443
29,769
49,357
180,303
3,411,376
27,404
271,197
298,601
$ 3,709,977
3.87%
4.06
3.61
4.15
2.79
6.37
7.50
4.68
1.85
4.51
4.40
2.88
4.43
5.39
2.64
2.04
2.63
3.80
$
4Q22
QUARTERLY TRENDS
595,631
306,173
192,412
302,825
625,388
1,126,002
116,640
3,265,071
126,138
78,476
285,586
$ 3,755,271
$ 1,695,233
247,934
39,843
256,533
12,312
246,978
2,498,833
684,921
35,415
56,988
191,929
3,468,086
28,415
258,770
287,185
$ 3,755,271
3.14 %
2.95
2.84
3.75
2.36
5.83
5.76
4.03
1.37
3.15
3.60
2.38
3.74
4.87
2.04
1.99
2.47
3.41
3Q22
$
652,321
322,053
204,479
283,414
647,165
1,112,761
122,756
3,344,949
129,221
83,950
284,127
$ 3,842,247
$ 1,728,852
239,582
45,797
278,049
11,039
253,012
2,556,331
716,518
36,985
56,994
189,637
3,556,465
32,838
252,944
285,782
$ 3,842,247
1.83 %
1.74
1.50
3.36
1.84
5.00
3.57
3.05
0.73
1.98
1.98
1.49
2.24
3.77
1.26
1.79
2.09
2.81
2Q22
$ 694,644
305,132
207,437
273,736
672,799
1,093,106
139,040
3,385,894
151,309
84,483
289,957
$ 3,911,643
$ 1,790,421
233,376
50,833
274,435
10,577
246,195
2,605,837
741,891
40,937
61,026
181,128
3,630,819
32,838
247,986
280,824
$ 3,911,643
0.62%
0.71
0.33
3.02
1.55
4.28
1.85
2.22
0.20
0.76
0.91
0.69
1.11
2.54
0.54
1.68
1.80
2.26
2Q23 Change
1Q23
✩ ✦ €ọ @ọ € + ‡ Ñ€ +
(2)%
4
(1)
10
(2)
10
(7)
4
11
(2)
(1)
3
5
(9)
6
18
18
5
3
(4)
4
2
2
4
JPMORGAN CHASE & CO.
SIX MONTHS ENDED JUNE 30,
2Q22
(29)%
7
- @❤æ❤§¤ƒˆˆ € 85ˆˆˆˆˆ ª • ª
$
2023
500,311
319,911
192,114
374,908
616,772
1,184,231
92,372
3,280,619
160,868
63,929
275,657
$ 3,781,073
$ 1,692,993
258,045
37,039
285,467
14,722
271,912
2,560,178
661,138
29,137
48,139
180,517
3,479,109
27,404
274,560
301,964
$ 3,781,073
4.03 %
4.35
3.76
4.13
2.90
6.49
8.15
4.85
2.05
4.85
4.63
3.07
4.71
5.33
2.85
2.00
2.63
3.82
$
2022
718,346
300,070
212,704
272,931
671,987
1,080,939
136,902
3,393,879
154,093
75,956
285,301
$ 3,909,229
$ 1,785,896
241,749
49,360
268,762
10,733
250,165
2,606,665
738,083
42,159
57,792
181,116
3,625,815
33,180
250,234
283,414
$ 3,909,229
0.37 %
0.63
0.08
2.83
1.47
4.16
1.42
2.04
0.12
0.47
0.64
0.50
0.90
2.13
0.40
1.64
1.74
2.11
(a) Includes brokerage-related held-for-investment customer receivables, which are classified in accrued interest and accounts receivable, and all other interest-earning assets, which are classified in other assets, on the Consolidated Balance Sheets.
(b) Includes commercial paper.
(c) All other interest-bearing liabilities include brokerage-related customer payables.
(d) Interest includes the effect of related hedging derivatives. Taxable-equivalent amounts are used where applicable.
(e) Net yield on interest-earning assets excluding Markets is a non-GAAP financial measure. Refer to page 29 for a further discussion of this measure.
2023 Change
2022
(30)%
7
(10)
37
(8)
10
(33)
(3)
4
(16)
(3)
(3)
(5)
7
(25)
6
37
9
(2)
(10)
(31)
(17)
(4)
(17)
10
7
(3)
Page 6View entire presentation