Wirecard Results Presentation Deck
in EUR million
Revenues
Own work capitalised
Cost of materials
Gross profit
Personnel expenses
Other operating expenses
Impairment losses of financial assets
Other operating income
Share of profit or loss from associates (at equity)
EBITDA
Amortisation and depreciation
EBIT
Financial result
Earnings before taxes
Income tax expenses
Earnings after taxes
EBITDA
Amortisation and depreciation (M&A adjusted)
EBIT adjusted**
Amortisation and depreciation (M&A related)
EBIT
* Taxes on income and profit with regards to Earnings before Taxes (EBT)
** Adjusted by amortisation (M&A related)
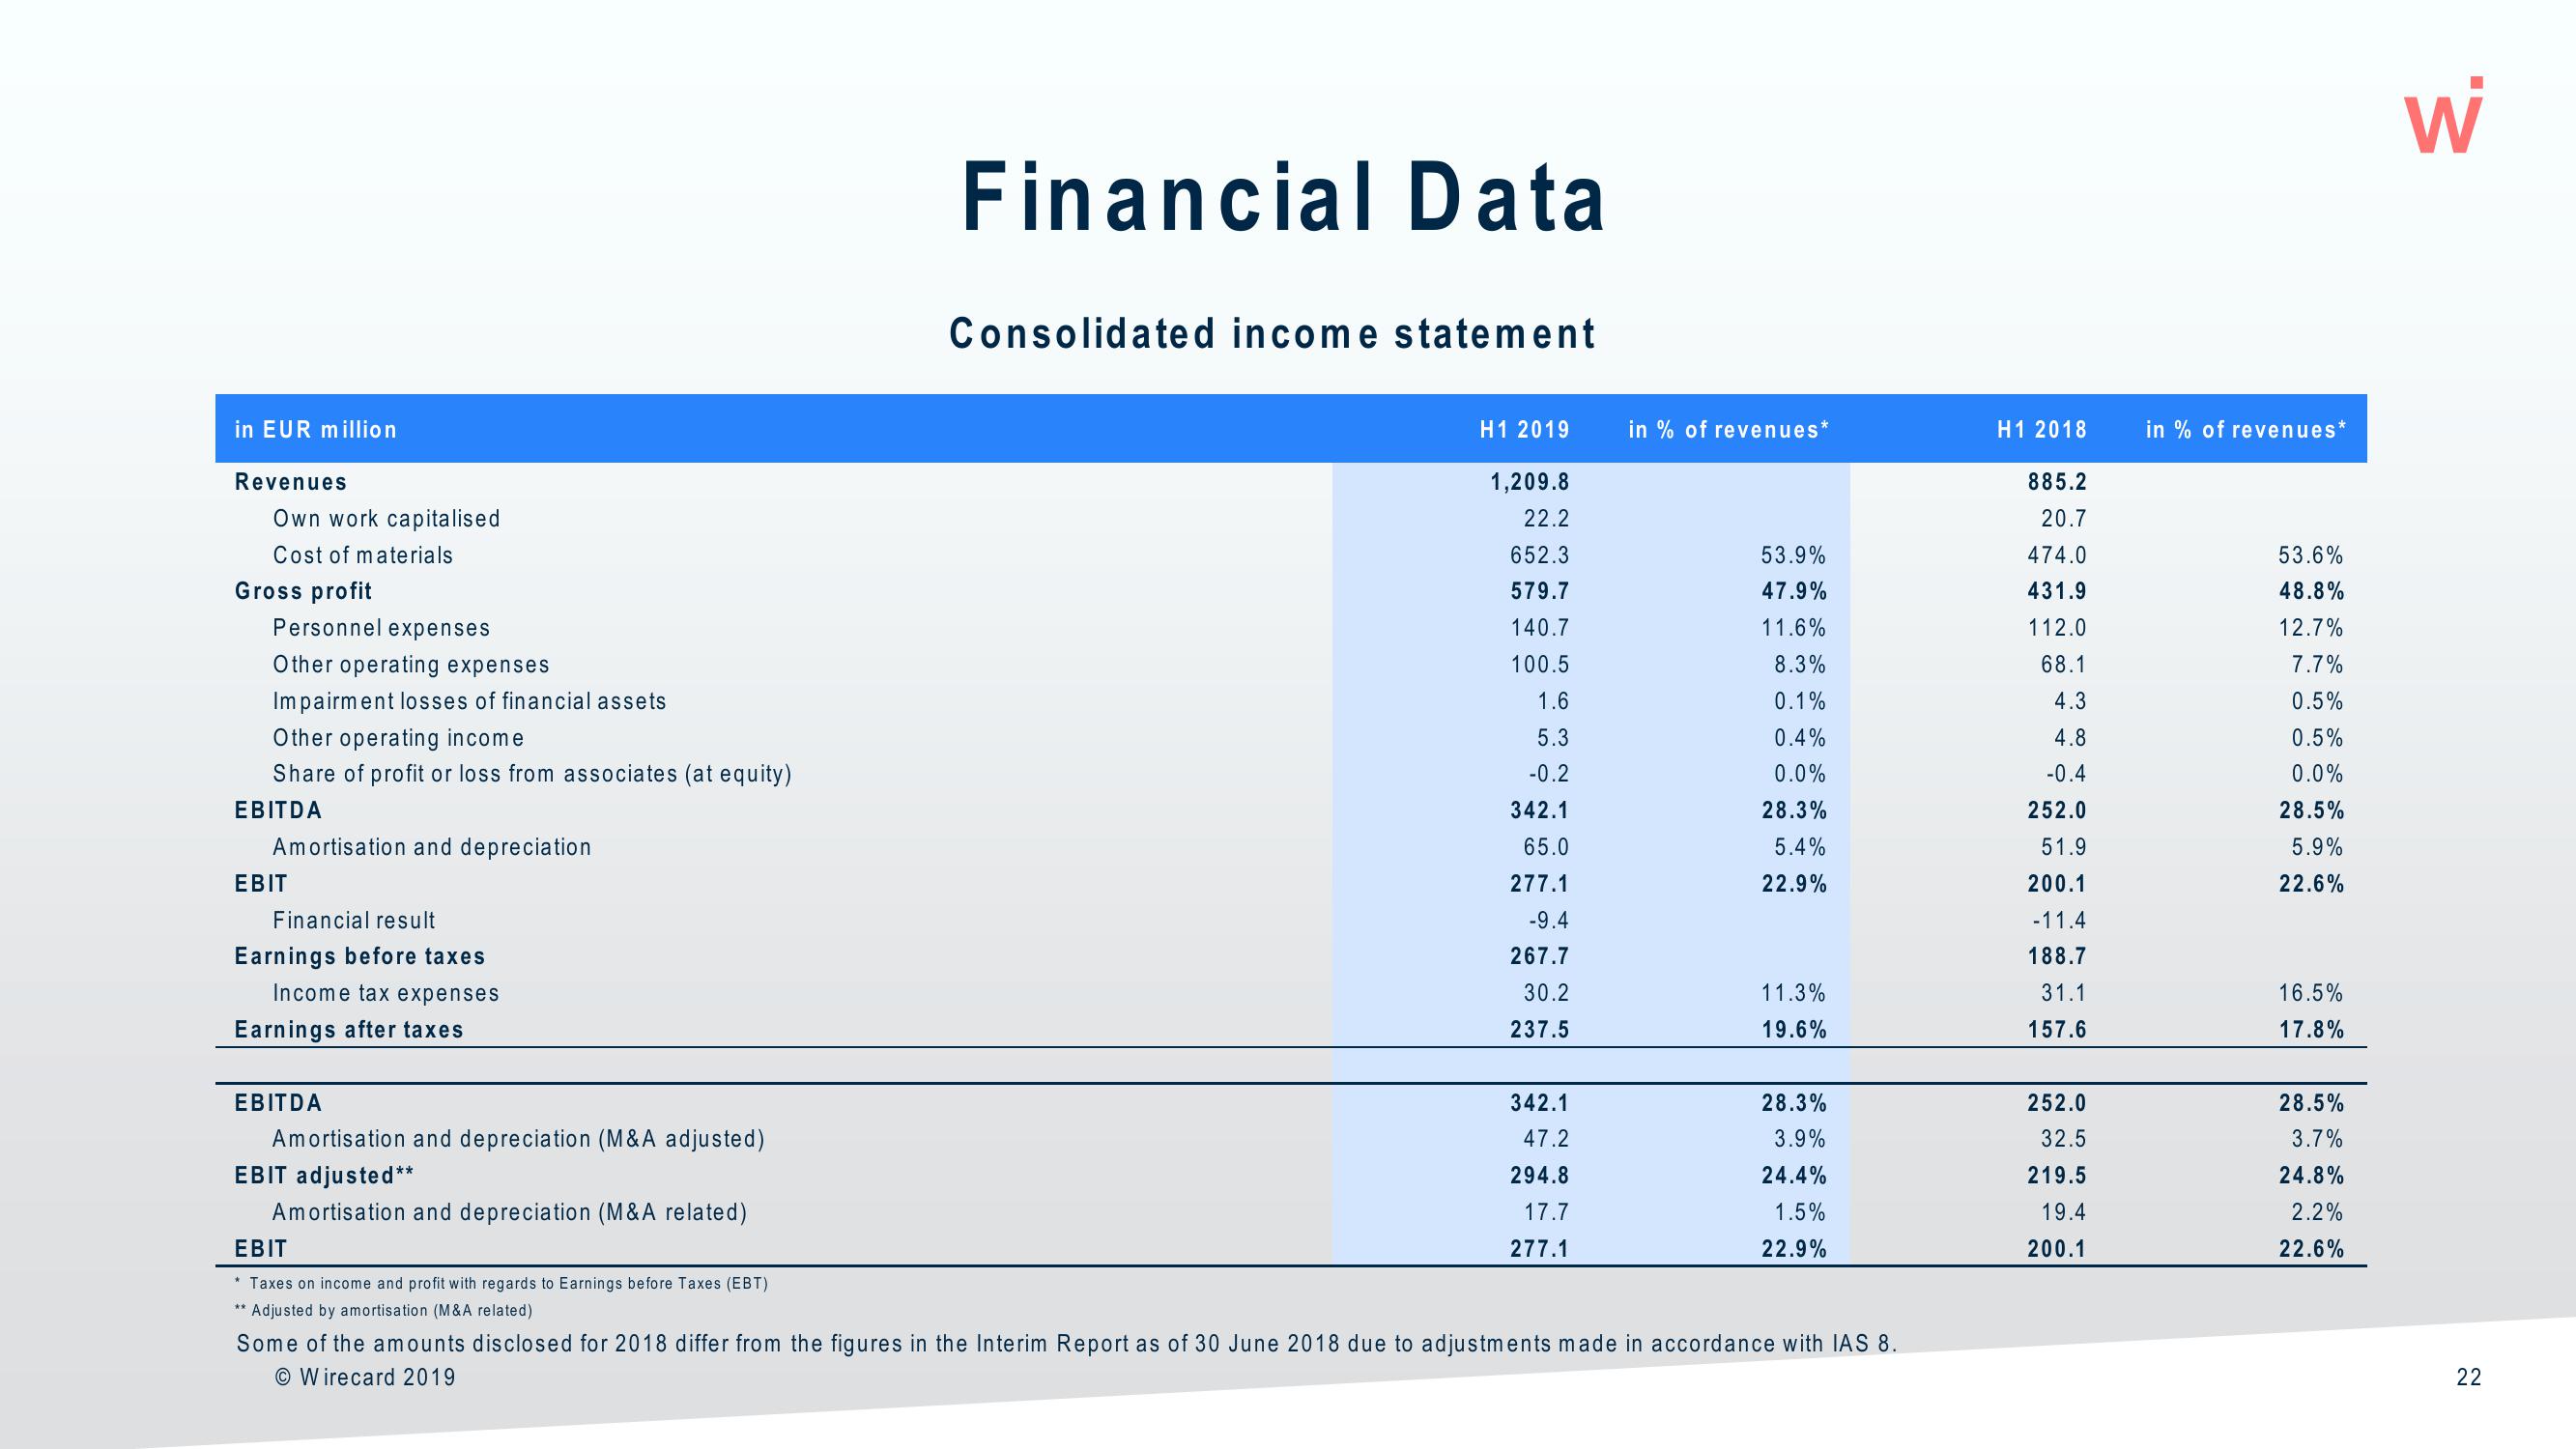
Financial Data
Consolidated income statement
H1 2019
1,209.8
22.2
652.3
579.7
140.7
100.5
1.6
5.3
-0.2
342.1
65.0
277.1
-9.4
267.7
30.2
237.5
342.1
47.2
294.8
17.7
277.1
in % of revenues*
53.9%
47.9%
11.6%
8.3%
0.1%
0.4%
0.0%
28.3%
5.4%
22.9%
11.3%
19.6%
28.3%
3.9%
24.4%
1.5%
22.9%
Some of the amounts disclosed for 2018 differ from the figures in the Interim Report as of 30 June 2018 due to adjustments made in accordance with IAS 8.
O Wirecard 2019
H1 2018
885.2
20.7
474.0
431.9
112.0
68.1
4.3
4.8
-0.4
252.0
51.9
200.1
-11.4
188.7
31.1
157.6
252.0
32.5
219.5
19.4
200.1
in % of revenues*
53.6%
48.8%
12.7%
7.7%
0.5%
0.5%
0.0%
28.5%
5.9%
22.6%
16.5%
17.8%
28.5%
3.7%
24.8%
2.2%
22.6%
W
22View entire presentation