OppFi Results Presentation Deck
3Q21 Financial Results
($ in thousands, except per share
values)
Total Revenue
Adj. Revenue¹
Net Income
Adj. Net Income¹
Adj. Net Income Margin
Adj. EBITDA¹
Adj. EBITDA Margin
Basic & Diluted EPS
Adj. Basic & Diluted EPS¹
Unaudited
Three Months Ended
9/30/2020
9/30/2021
$91,977
$91,977
$30,392
$17,362
18.9%
$31,779
34.6%
$1.06
$0.21
$62,759
$73,577
$19,342
$19,484
26.5%
$32,402
44.0%
YOY %
46.6%
25.0%
57,1%
(10.9)%
(760bps)
(1.9)%
(940bps)
Key Highlights
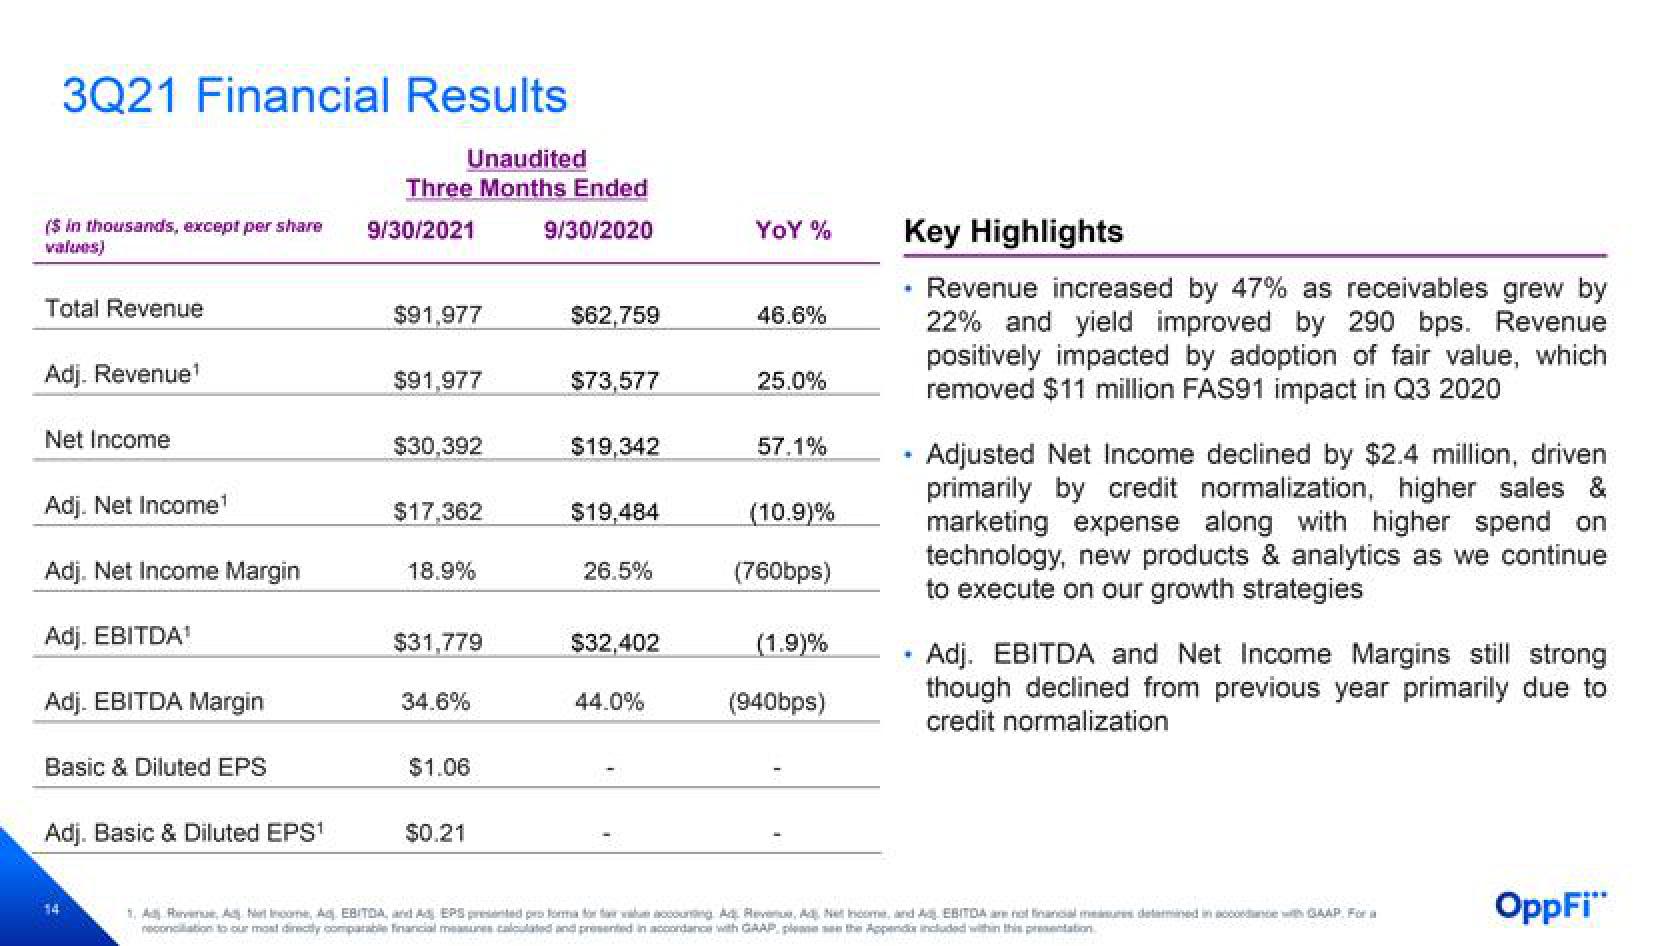
Revenue increased by 47% as receivables grew by
22% and yield improved by 290 bps. Revenue
positively impacted by adoption of fair value, which
removed $11 million FAS91 impact in Q3 2020
☐
·
.
Adjusted Net Income declined by $2.4 million, driven
primarily by credit normalization, higher sales &
marketing expense along with higher spend on
technology, new products & analytics as we continue
to execute on our growth strategies
Adj. EBITDA and Net Income Margins still strong
though declined from previous year primarily due to
credit normalization
1, ARA Net Income, Adj. EBITDA, and Ad EPS presented pro form for whaccounting Ad. Revenue, A. Net Income, and Ad. EBITDA are not financialmente determined in accordance with GAAP. For a
conciliation to our most directly comparable financial measures calculated and presented in accordance with GAAP. please see the Appends included within this presentation
OppFi"View entire presentation