MaxCyte IPO Presentation Deck
2020
2019
2018
2017
2016
2015
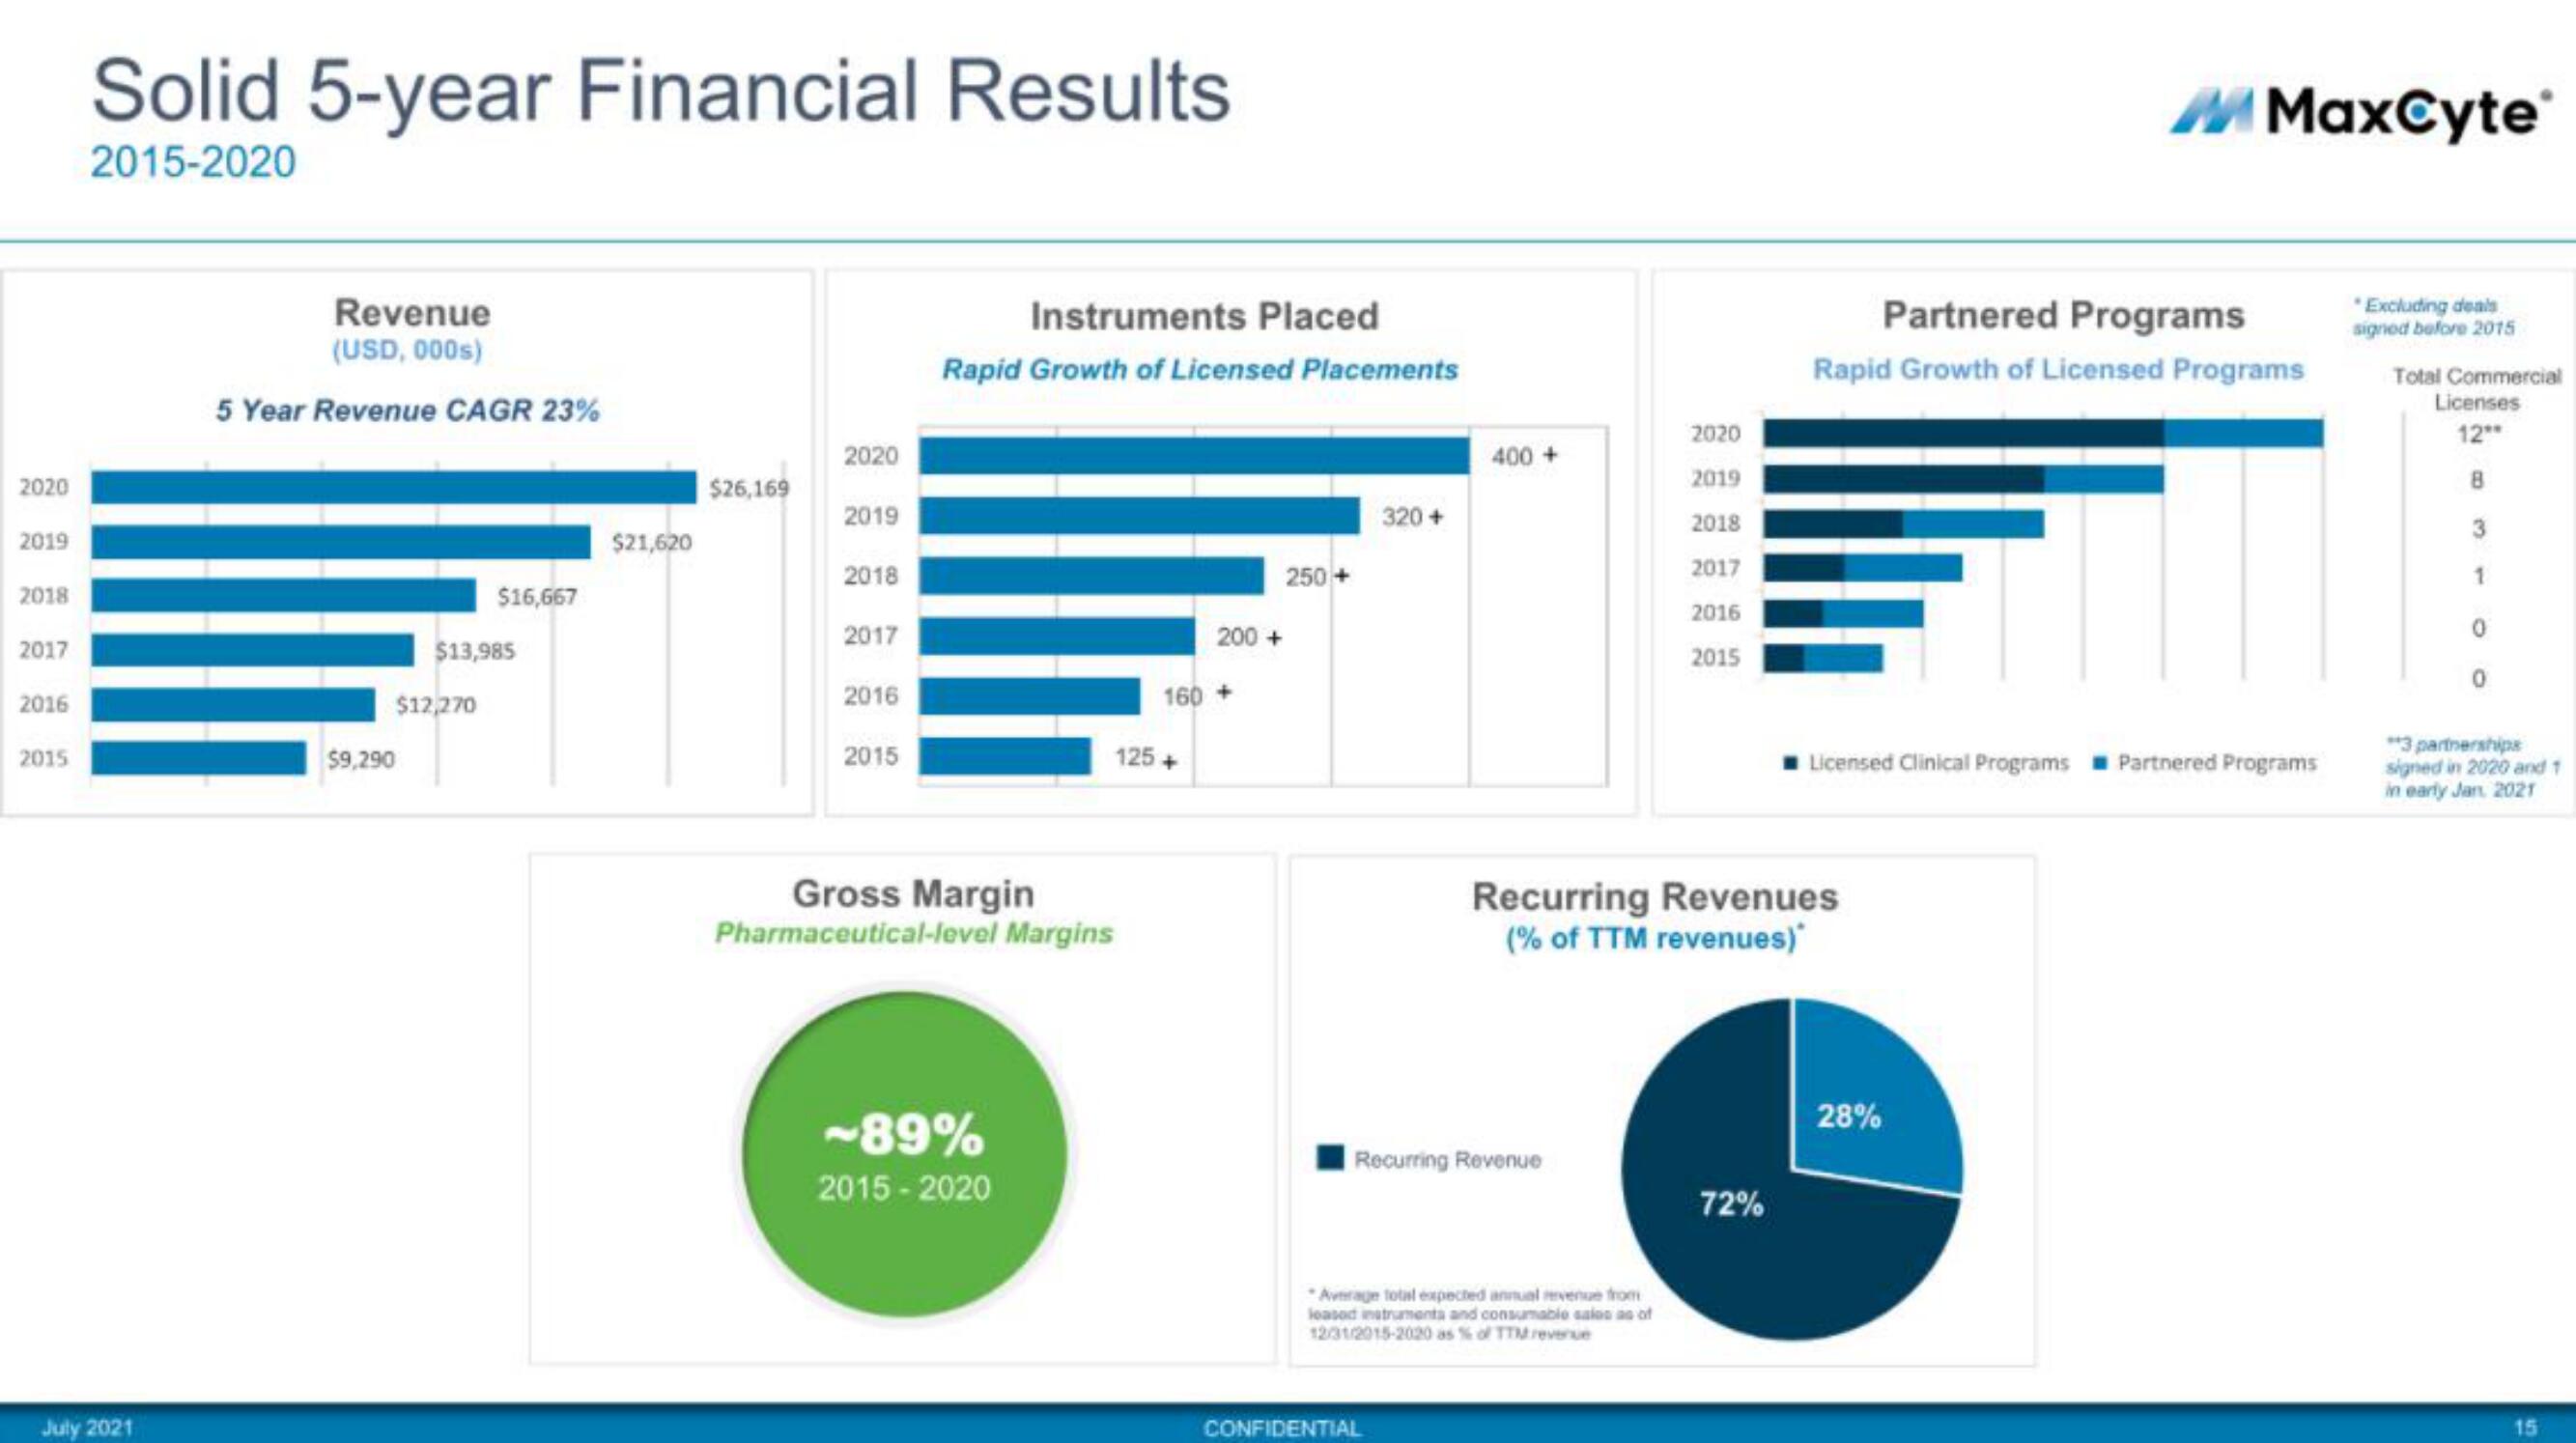
Solid 5-year Financial Results
2015-2020
July 2021
Revenue
(USD, 000s)
5 Year Revenue CAGR 23%
$12,270
$9,290
$16,667
$13,985
$21,620
$26,169
2020
2019
2018
2017
2016
2015
Instruments Placed
Rapid Growth of Licensed Placements
Gross Margin
Pharmaceutical-level Margins
~89%
2015-2020
160
125 +
250+
200 +
320 +
400 +
CONFIDENTIAL
Recurring Revenue
Average total expected annual revenue from
leased instruments and consumabie sales as of
12/31/2015-2020 as % of TTM revenue
2020
2019
2018
2017
2016
2015
Recurring Revenues
(% of TTM revenues)
72%
Partnered Programs
Rapid Growth of Licensed Programs
Licensed Clinical Programs
M MaxCyte
28%
Partnered Programs
*Excluding deals
signed before 2015
Total Commercial
Licenses
12**
8
3
1
0
"3 partnerships
signed in 2020 and 1
in early Jan, 2021
15View entire presentation