Taboola Investor Presentation Deck
TABOOLA FOCUSES
ON PROFITABLE GROWTH
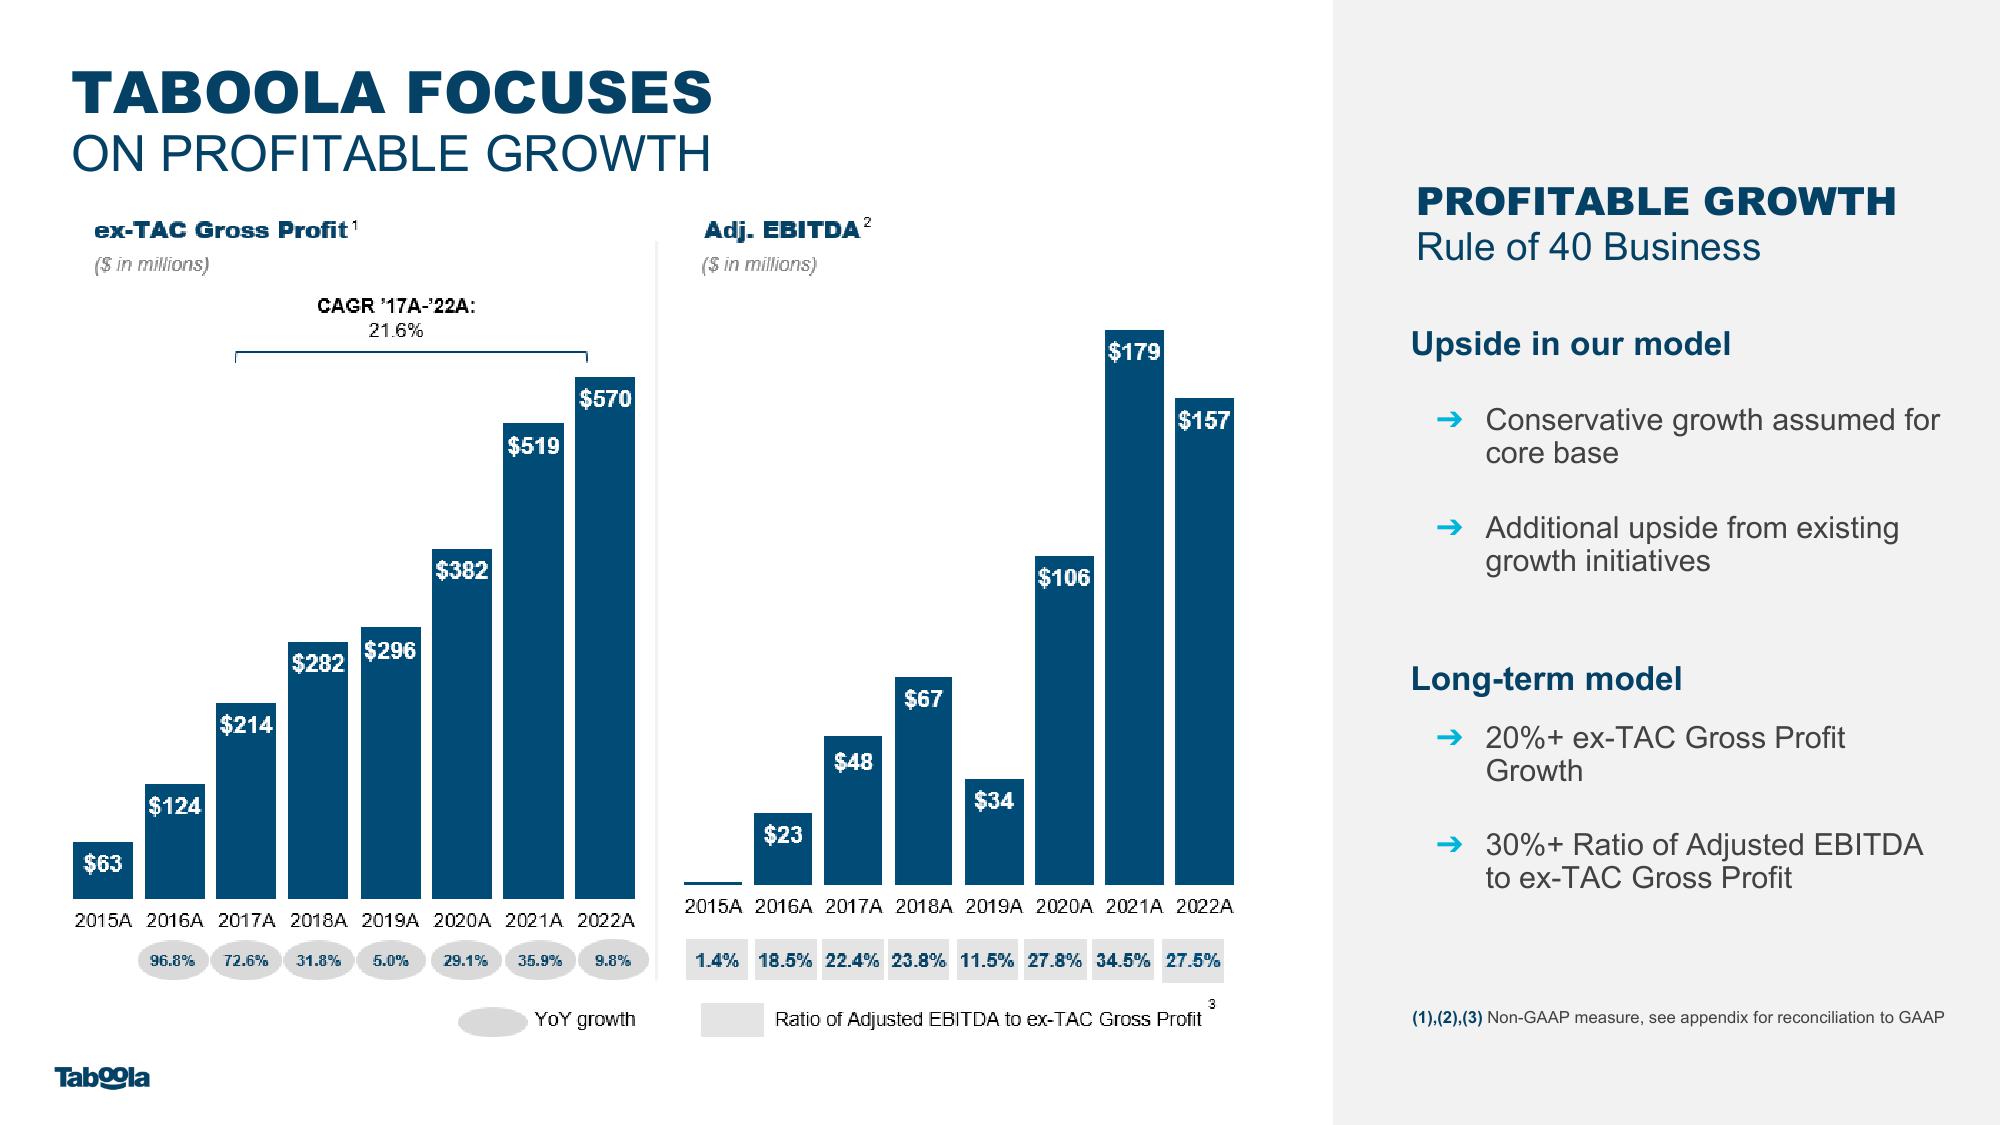
ex-TAC Gross Profit ¹
($ in millions)
$124
$214
Taboola
CAGR '17A-¹22A:
$282
21.6%
$296
$382
$519
$570
$63
2015A 2016A 2017A 2018A 2019A 2020A 2021A 2022A
96.8% 72.6% 31.8% 5.0% 29.1% 35.9% 9.8%
YOY growth
Adj. EBITDA²
($ in millions)
$23
$48
$67
$34
$106
$179
$157
2015A 2016A 2017A 2018A 2019A 2020A 2021A 2022A
1.4% 18.5% 22.4% 23.8% 11.5% 27.8% 34.5% 27.5%
Ratio of Adjusted EBITDA to ex-TAC Gross Profit
3
PROFITABLE GROWTH
Rule of 40 Business
Upside in our model
Conservative growth assumed for
core base
→ Additional upside from existing
growth initiatives
Long-term model
20%+ ex-TAC Gross Profit
Growth
→ 30% + Ratio of Adjusted EBITDA
to ex-TAC Gross Profit
(1), (2), (3) Non-GAAP measure, see appendix for reconciliation to GAAPView entire presentation