UBS Results Presentation Deck
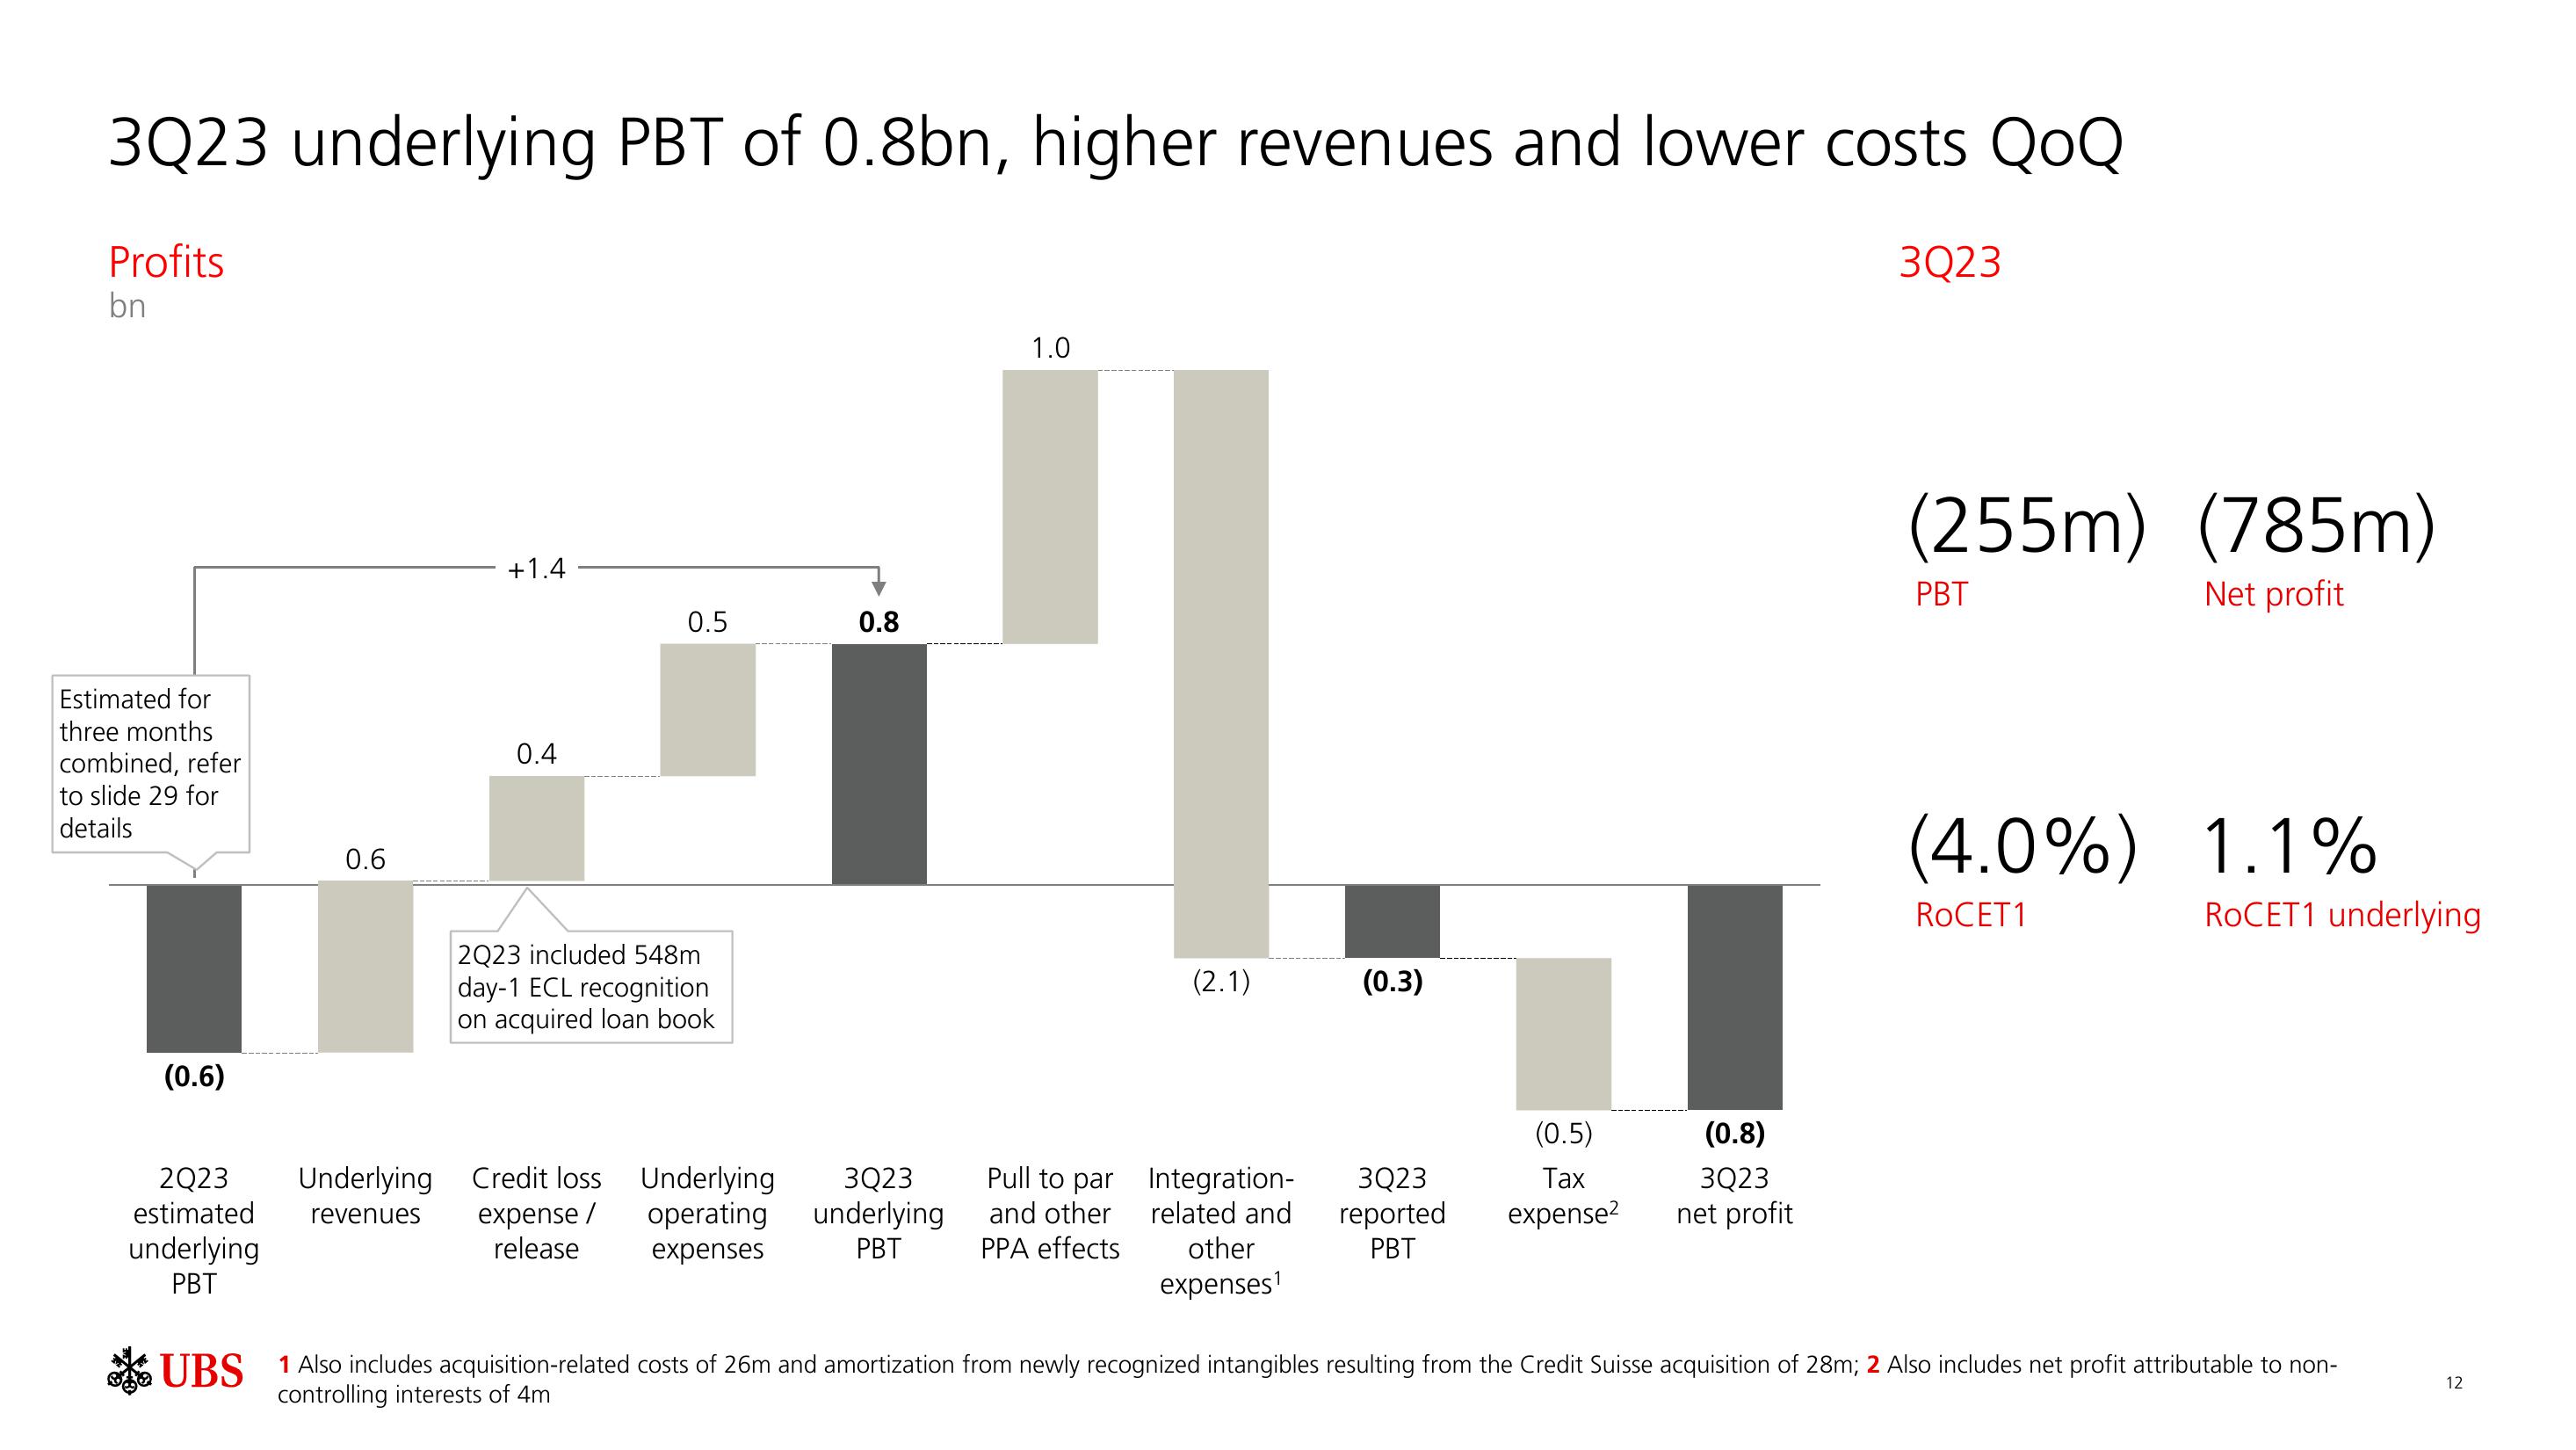
3Q23 underlying PBT of 0.8bn, higher revenues and lower costs QoQ
Profits
bn
Estimated for
three months
combined, refer
to slide 29 for
details
(0.6)
0.6
2Q23 Underlying
estimated revenues
underlying
PBT
+1.4
0.4
0.5
2Q23 included 548m
day-1 ECL recognition
on acquired loan book
Credit loss
expense /
release
Underlying
operating
expenses
0.8
3Q23
underlying
PBT
1.0
Pull to par
and other
PPA effects
(2.1)
Integration-
related and
other
expenses¹
(0.3)
(0.5)
3Q23
Tax
reported expense²
PBT
(0.8)
3Q23
net profit
3Q23
(255m) (785m)
Net profit
PBT
(4.0%) 1.1%
ROCET1
ROCET1 underlying
UBS 1 Also includes acquisition-related costs of 26m and amortization from newly recognized intangibles resulting from the Credit Suisse acquisition of 28m; 2 Also includes net profit attributable to non-
controlling interests of 4m
12View entire presentation