Topps SPAC Presentation Deck
%
growth
%
margin
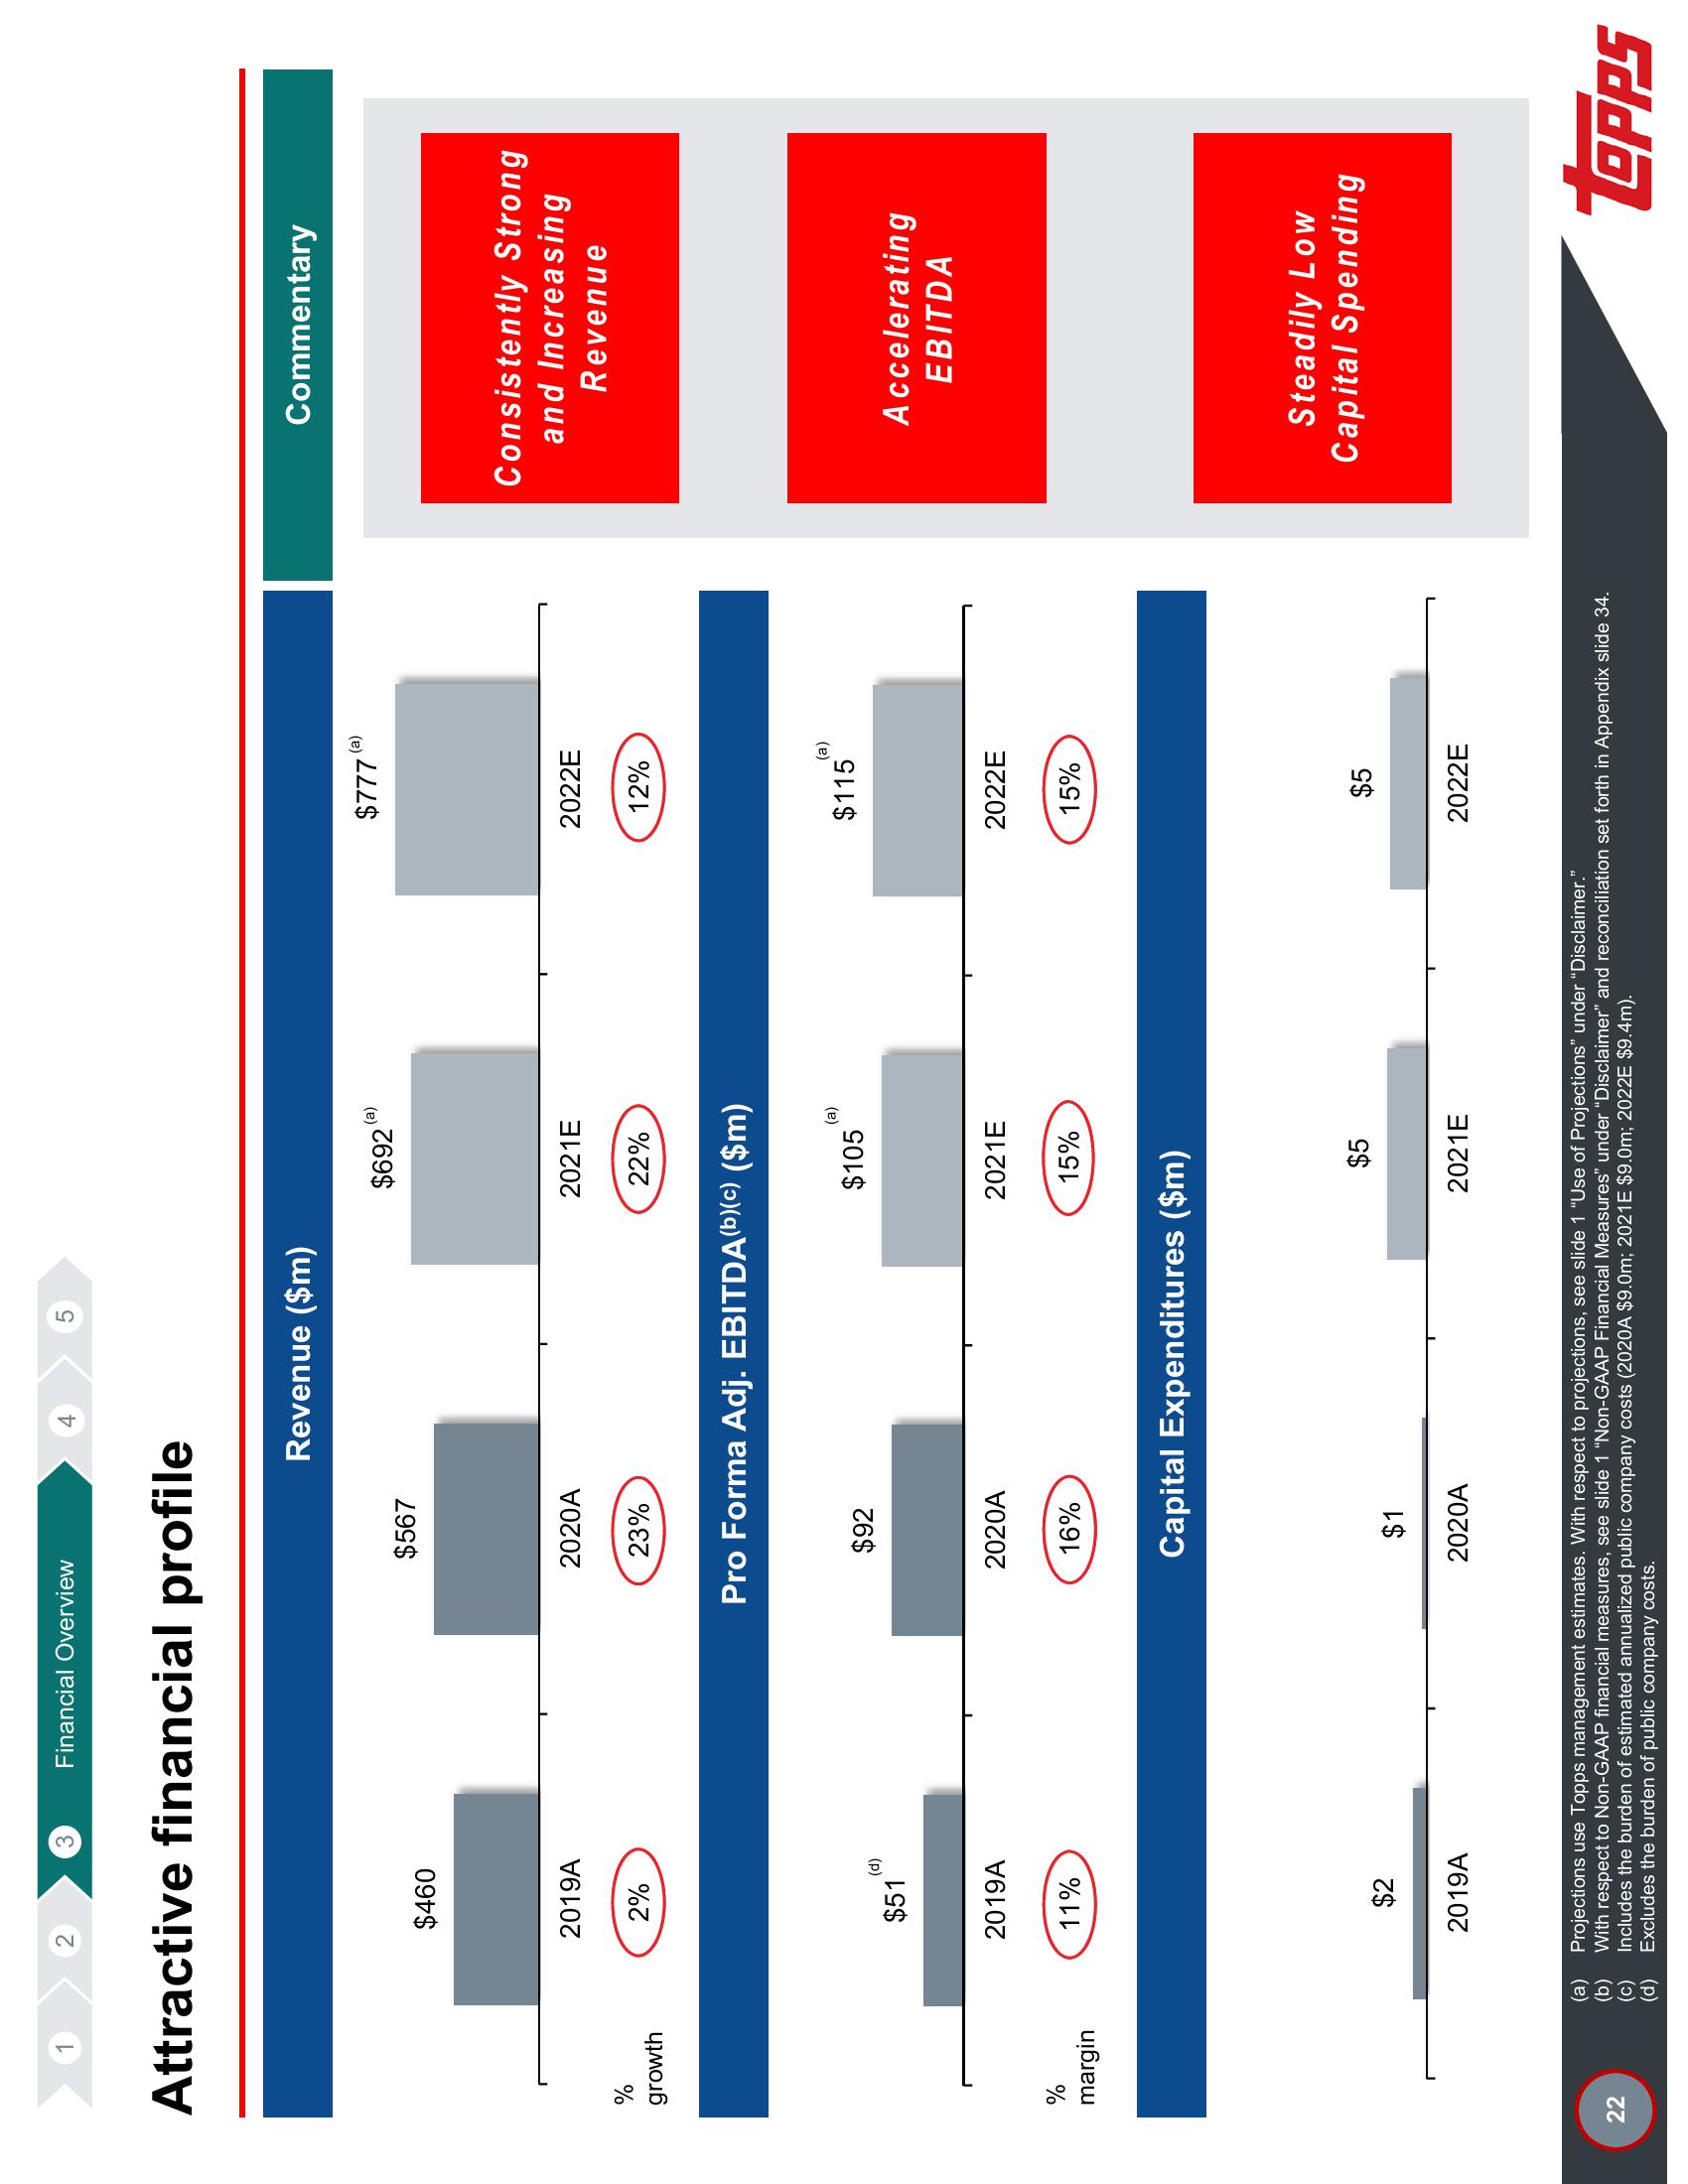
Attractive financial profile
22
2
(C)
(d)
$460
2019A
2%
$51
(d)
2019A
11%
$2
3
2019A
Financial Overview
$567
2020A
23%
$92
2020A
16%
4
$1
5
2020A
Revenue ($m)
Pro Forma Adj. EBITDA(b)(c) ($m)
$692
2021E
22%
$105
Capital Expenditures ($m)
(a)
15%
2021E
$5
(a)
2021E
$777
2022E
12%
$115
(a)
15%
(a)
2022E
$5
2022E
(a) Projections use Topps management estimates. With respect to projections, see slide 1 "Use of Projections" under "Disclaimer."
(b)
With respect to Non-GAAP financial measures, see slide 1 "Non-GAAP Financial Measures" under "Disclaimer" and reconciliation set forth in Appendix slide 34.
Includes the burden of estimated annualized public company costs (2020A $9.0m; 2021E $9.0m; 2022E $9.4m).
Excludes the burden of public company costs.
Commentary
Consistently Strong
and Increasing
Revenue
Accelerating
EBITDA
Steadily Low
Capital Spending
toppsView entire presentation