Evotec Results Presentation Deck
in € m¹)
evotec
Revenues from contracts with customers
Gross margin
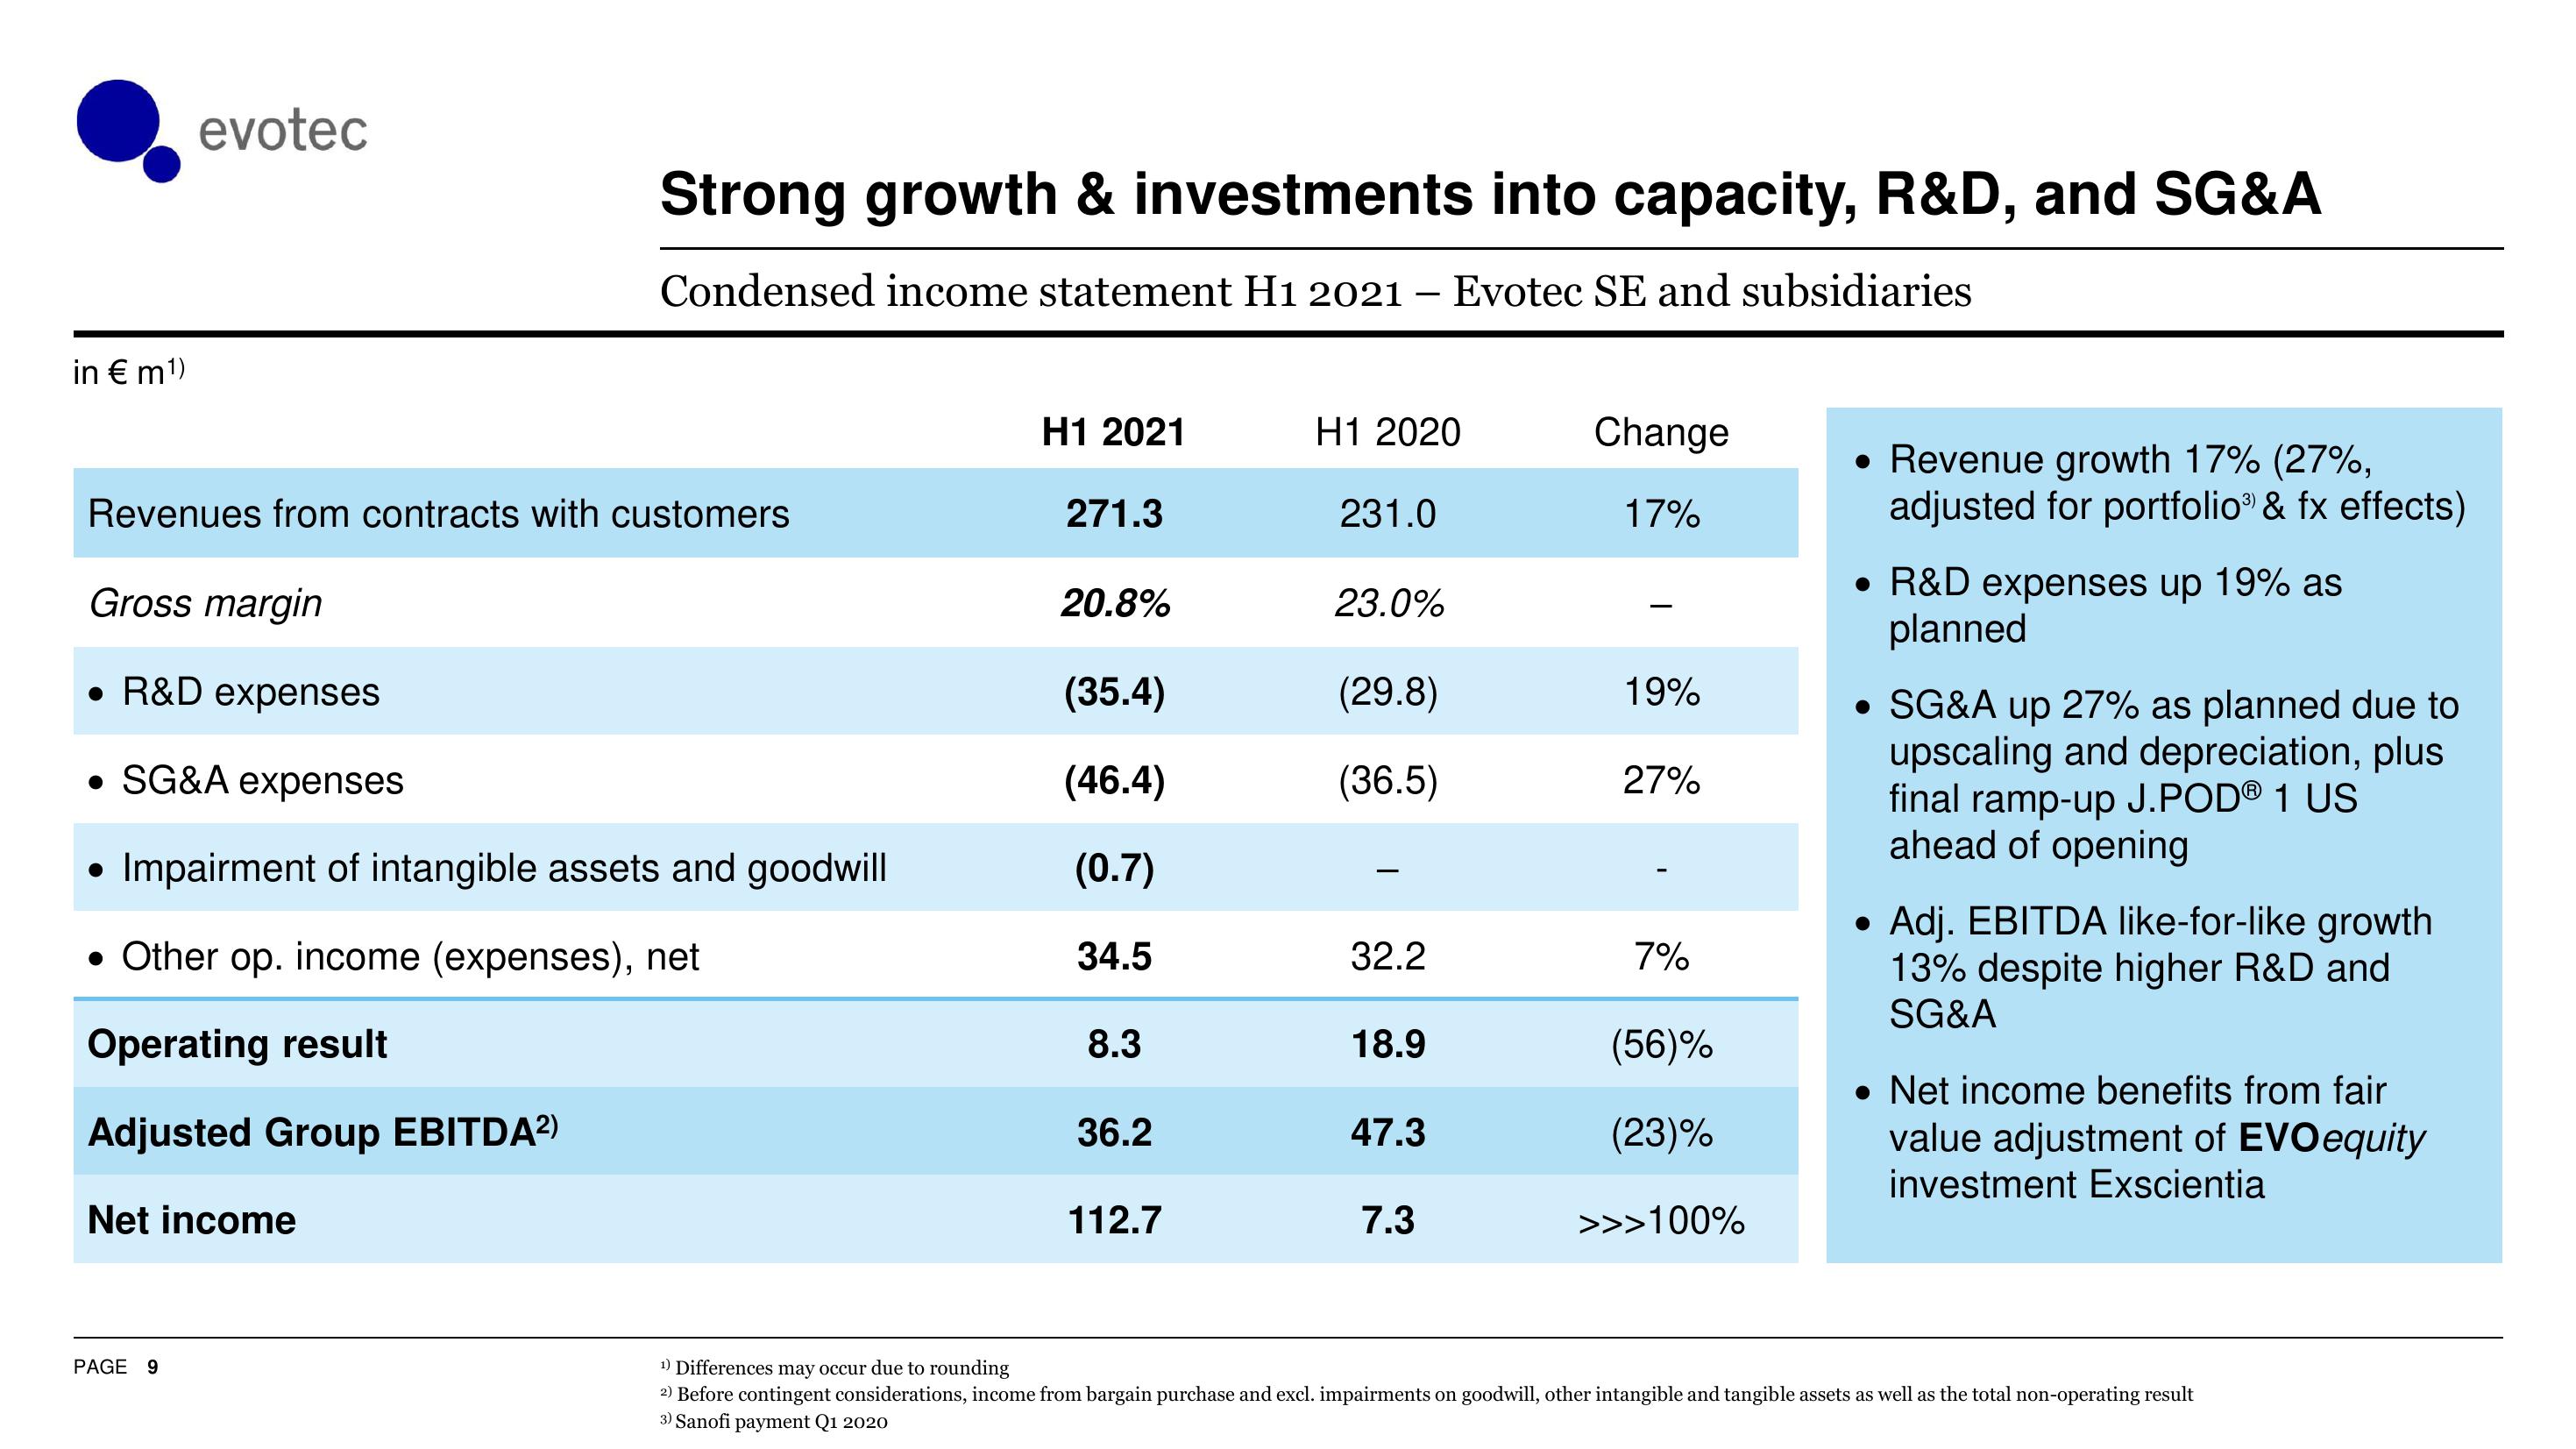
Strong growth & investments into capacity, R&D, and SG&A
Condensed income statement H1 2021 – Evotec SE and subsidiaries
R&D expenses
• SG&A expenses
• Impairment of intangible assets and goodwill
• Other op. income (expenses), net
Operating result
Adjusted Group EBITDA²)
Net income
PAGE 9
H1 2021
271.3
20.8%
(35.4)
(46.4)
(0.7)
34.5
8.3
36.2
112.7
H1 2020
231.0
23.0%
(29.8)
(36.5)
32.2
18.9
47.3
7.3
Change
17%
19%
27%
7%
(56)%
(23)%
>>>100%
• Revenue growth 17% (27%,
adjusted for portfolio & fx effects)
• R&D expenses up 19% as
planned
• SG&A up 27% as planned due to
upscaling and depreciation, plus
final ramp-up J.PODⓇ 1 US
ahead of opening
Adj. EBITDA like-for-like growth
13% despite higher R&D and
SG&A
• Net income benefits from fair
value adjustment of EVO equity
investment Exscientia
¹) Differences may occur due to rounding
2) Before contingent considerations, income from bargain purchase and excl. impairments on goodwill, other intangible and tangible assets as well as the total non-operating result
3) Sanofi payment Q1 2020View entire presentation