BlackRock Results Presentation Deck
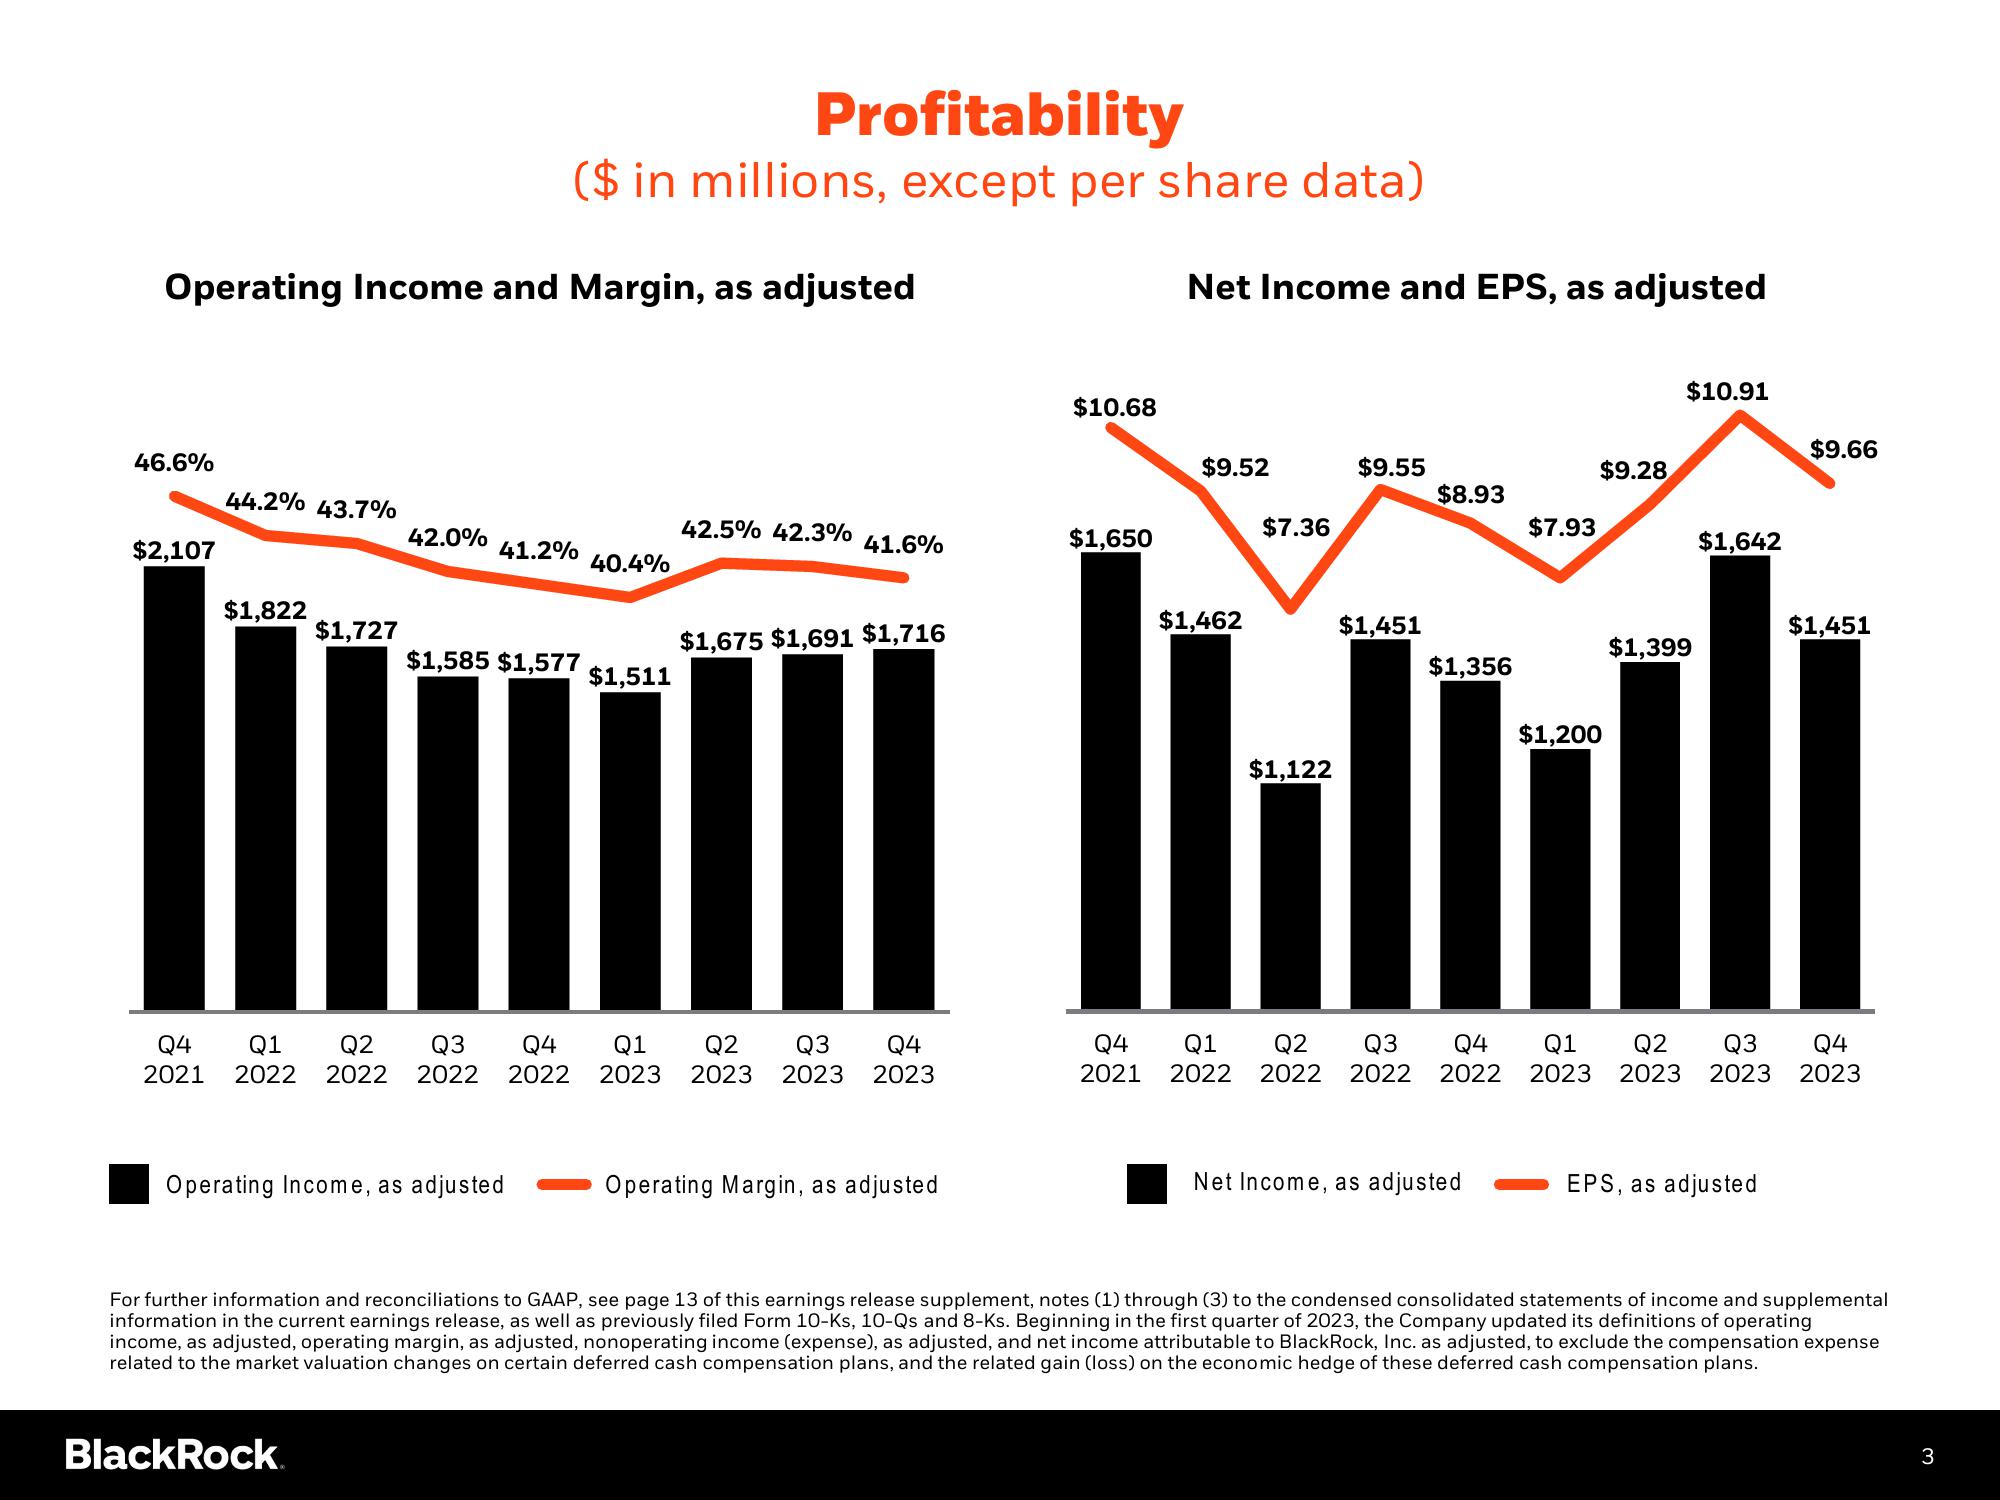
Operating Income and Margin, as adjusted
46.6
$2,107
44.2% 43.7%
$1,822
$1,727
42.0%
BlackRock
Profitability
($ in millions, except per share data)
41.2%
Q4 Q1 Q2 Q3 Q4
2021 2022 2022 2022 2022
$1,585 $1,577
Operating Income, as adjusted
40.4%
$1,511
42.5% 42.3%
41.6%
$1,675 $1,691 $1,716
Q1 Q2 Q3 Q4
2023 2023 2023 2023
Operating Margin, as adjusted
$10.68
$1,650
Net Income and EPS, as adjusted
$9.52
$1,462
$7.36
$1,122
$9.55
$1,451
$8.93
$1,356
Q4 Q1 Q2 Q3 Q4
2021 2022 2022 2022 2022
Net Income, as adjusted
$7.93
$9.28
$1,200
$10.91
$1,399
$1,642
$9.66
EPS, as adjusted
$1,451
Q1 Q2 Q3 Q4
2023 2023 2023 2023
For further information and reconciliations to GAAP, see page 13 of this earnings release supplement, notes (1) through (3) to the condensed consolidated statements of income and supplemental
information in the current earnings release, as well as previously filed Form 10-Ks, 10-Qs and 8-Ks. Beginning in the first quarter of 2023, the Company updated its definitions of operating
income, as adjusted, operating margin, as adjusted, nonoperating income (expense), as adjusted, and net income attributable to BlackRock, Inc. as adjusted, to exclude the compensation expense
related to the market valuation changes on certain deferred cash compensation plans, and the related gain (loss) on the economic hedge of these deferred cash compensation plans.
3View entire presentation