FAT Brands Investor Presentation Deck
YTD Q3 2023 HIGHLIGHTS
(1)
(2)
(3)
(4)
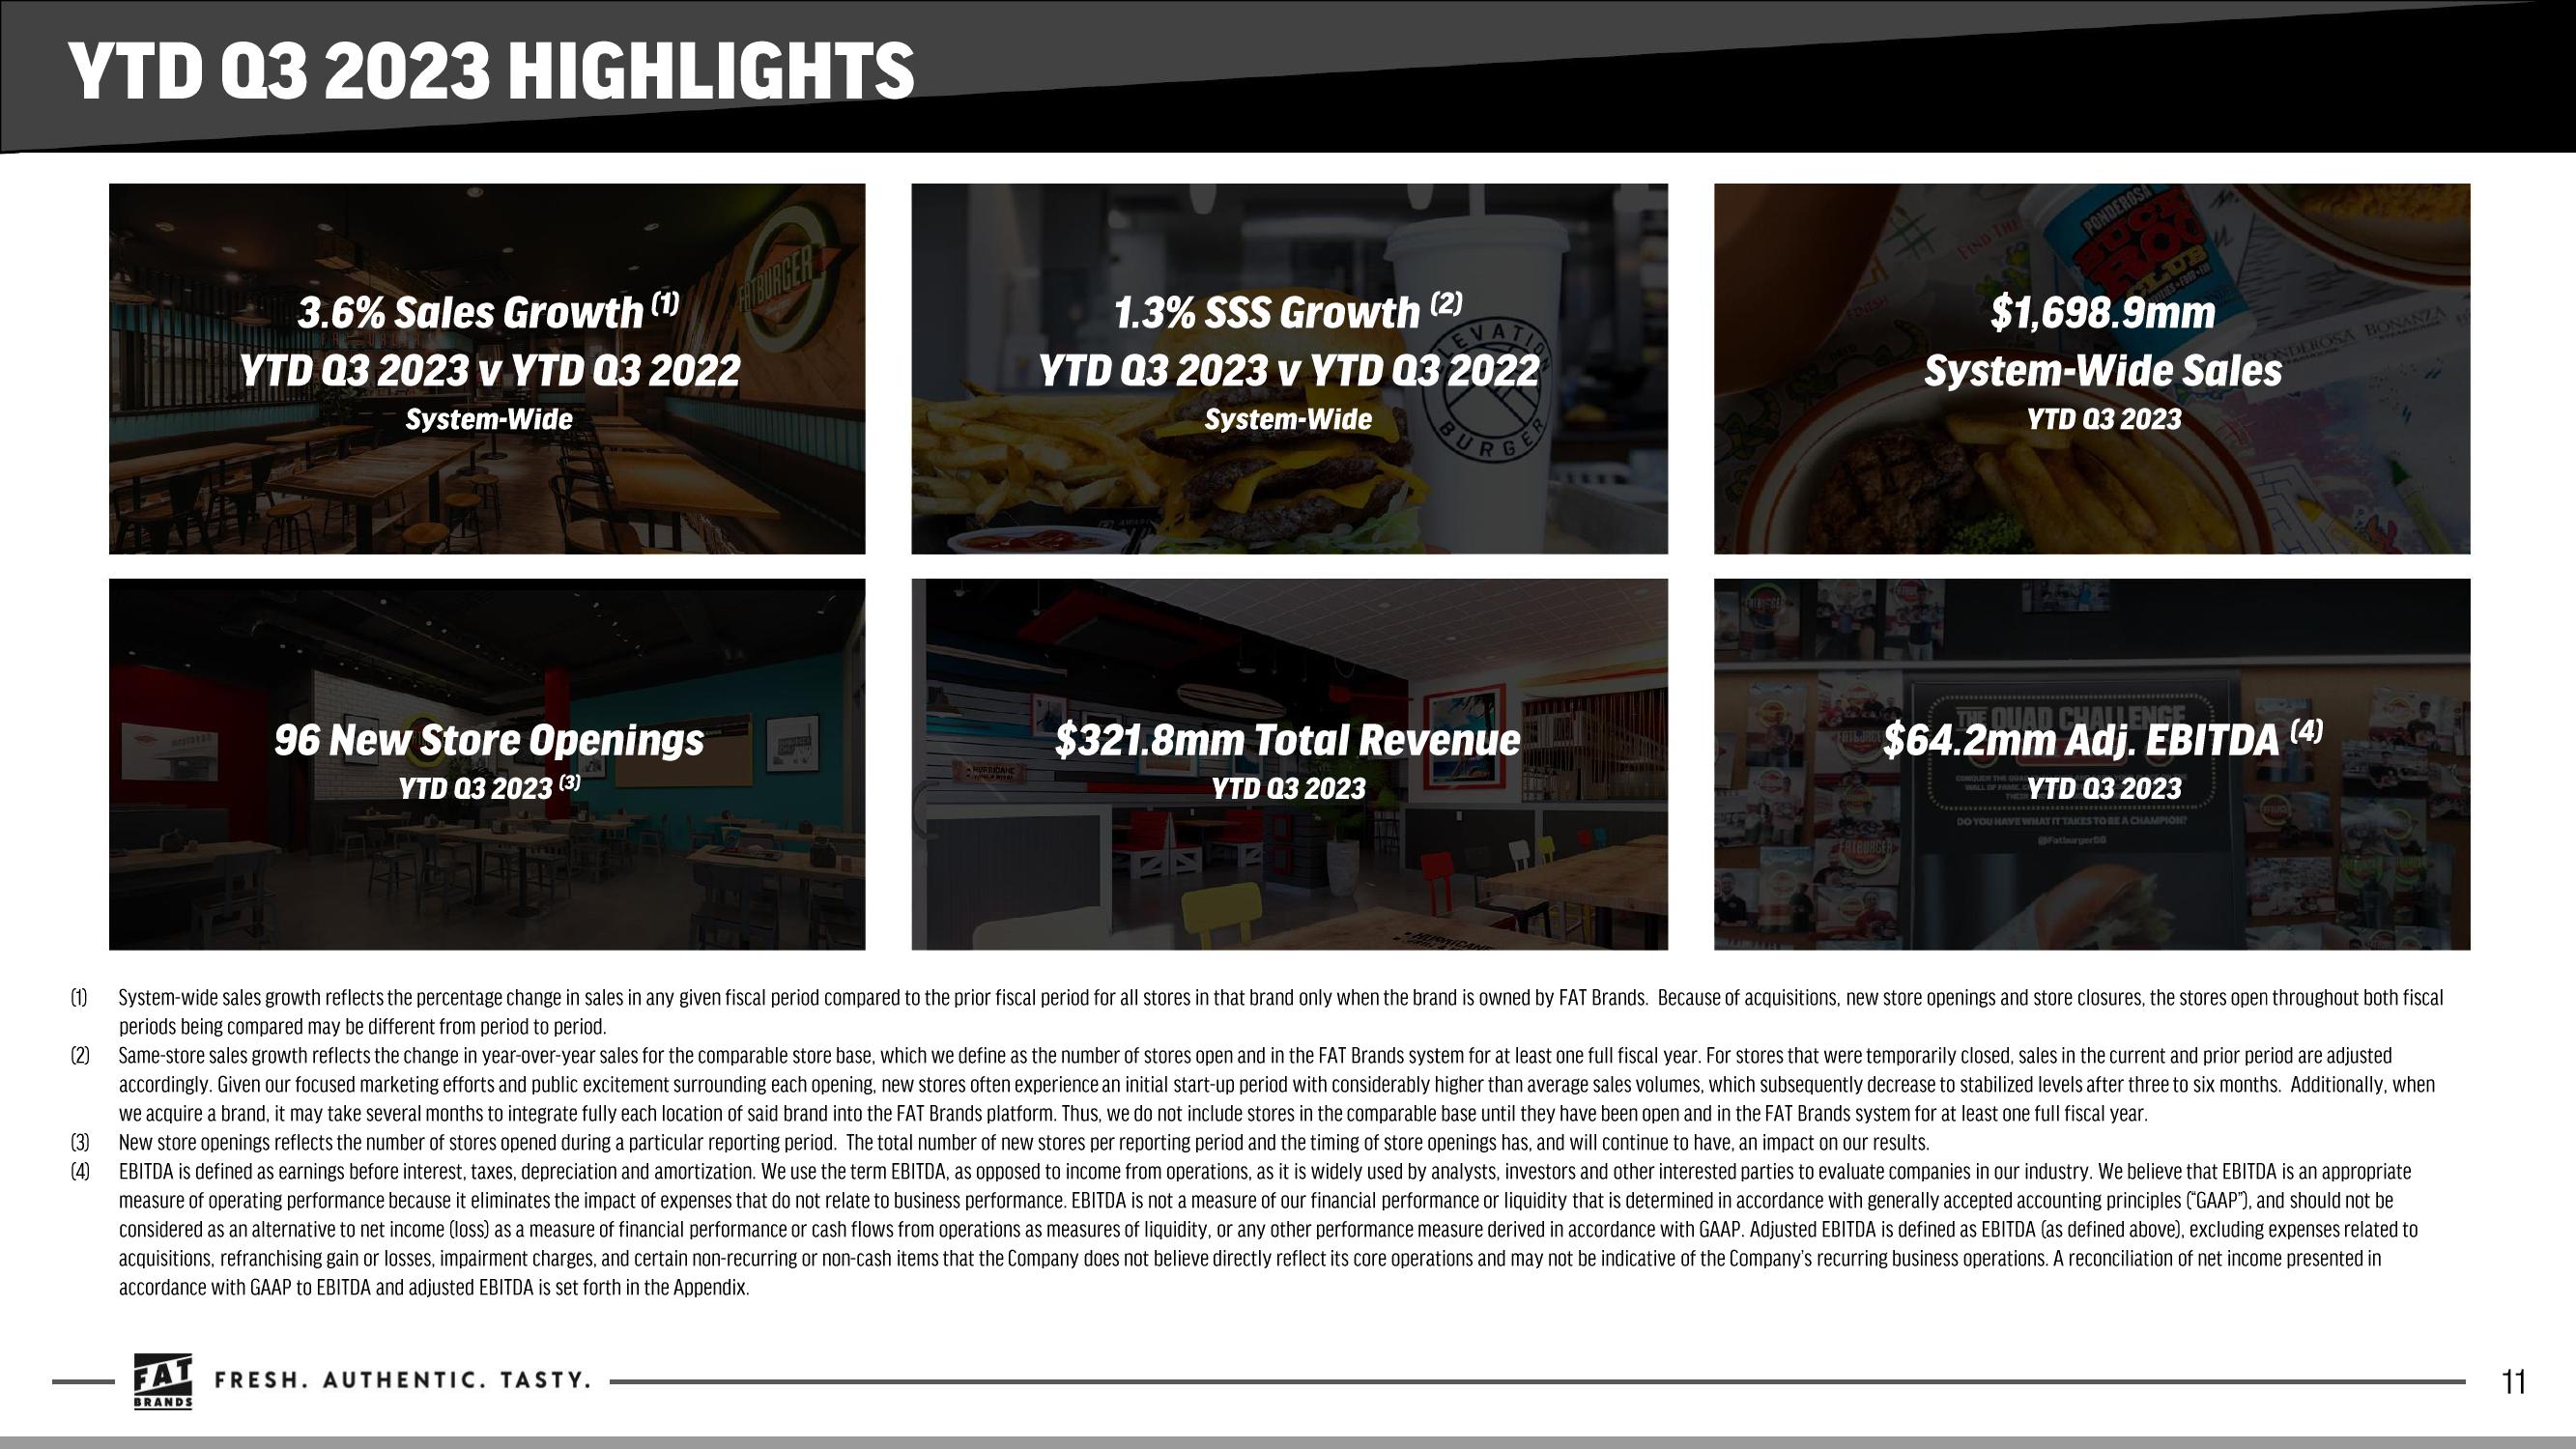
3.6% Sales Growth (1)
YTD Q3 2023 v YTD Q3 2022
System-Wide
96 New Store Openings
YTD 03 2023 (3)
HHH
FATBURGER
FAT FRESH. AUTHENTIC. TASTY.
BRANDS
WORBEDANC
1.3% SSS Growth (2)
YTD 03 2023 v YTD 03 2022
System-Wide
UR
H
G
$321.8mm Total Revenue
YTD 03 2023
KERTBURGER
FATLJAGER
FIND THE
FATBURGER
PONDEROSA
VELIES-FOOD-END
$1,698.9mm
System-Wide Sales
YTD Q3 2023
QUAD CHALLENGE
$64.2mm Adj. EBITDA (4)
PONDERNA BONANZA
YTD 03 2023
DO YOU HAVE WHAT IT TAKES TO BE A CHAMPION?
System-wide sales growth reflects the percentage change in sales in any given fiscal period compared to the prior fiscal period for all stores in that brand only when the brand is owned by FAT Brands. Because of acquisitions, new store openings and store closures, the stores open throughout both fiscal
periods being compared may be different from period to period.
Same-store sales growth reflects the change in year-over-year sales for the comparable store base, which we define as the number of stores open and in the FAT Brands system for at least one full fiscal year. For stores that were temporarily closed, sales in the current and prior period are adjusted
accordingly. Given our focused marketing efforts and public excitement surrounding each opening, new stores often experience an initial start-up period with considerably higher than average sales volumes, which subsequently decrease to stabilized levels after three to six months. Additionally, when
we acquire a brand, it may take several months to integrate fully each location of said brand into the FAT Brands platform. Thus, we do not include stores in the comparable base until they have been open and in the FAT Brands system for at least one full fiscal year.
New store openings reflects the number of stores opened during a particular reporting period. The total number of new stores per reporting period and the timing of store openings has, and will continue to have, an impact on our results.
EBITDA is defined as earnings before interest, taxes, depreciation and amortization. We use the term EBITDA, as opposed to income from operations, as it is widely used by analysts, investors and other interested parties to evaluate companies in our industry. We believe that EBITDA is an appropriate
measure of operating performance because it eliminates the impact of expenses that do not relate to business performance. EBITDA is not a measure of our financial performance or liquidity that is determined in accordance with generally accepted accounting principles ("GAAP"), and should not be
considered as an alternative to net income (loss) as a measure of financial performance or cash flows from operations as measures of liquidity, or any other performance measure derived in accordance with GAAP. Adjusted EBITDA is defined as EBITDA (as defined above), excluding expenses related to
acquisitions, refranchising gain or losses, impairment charges, and certain non-recurring or non-cash items that the Company does not believe directly reflect its core operations and may not be indicative of the Company's recurring business operations. A reconciliation of net income presented in
accordance with GAAP to EBITDA and adjusted EBITDA is set forth in the Appendix.
11View entire presentation