Credit Suisse Investment Banking Pitch Book
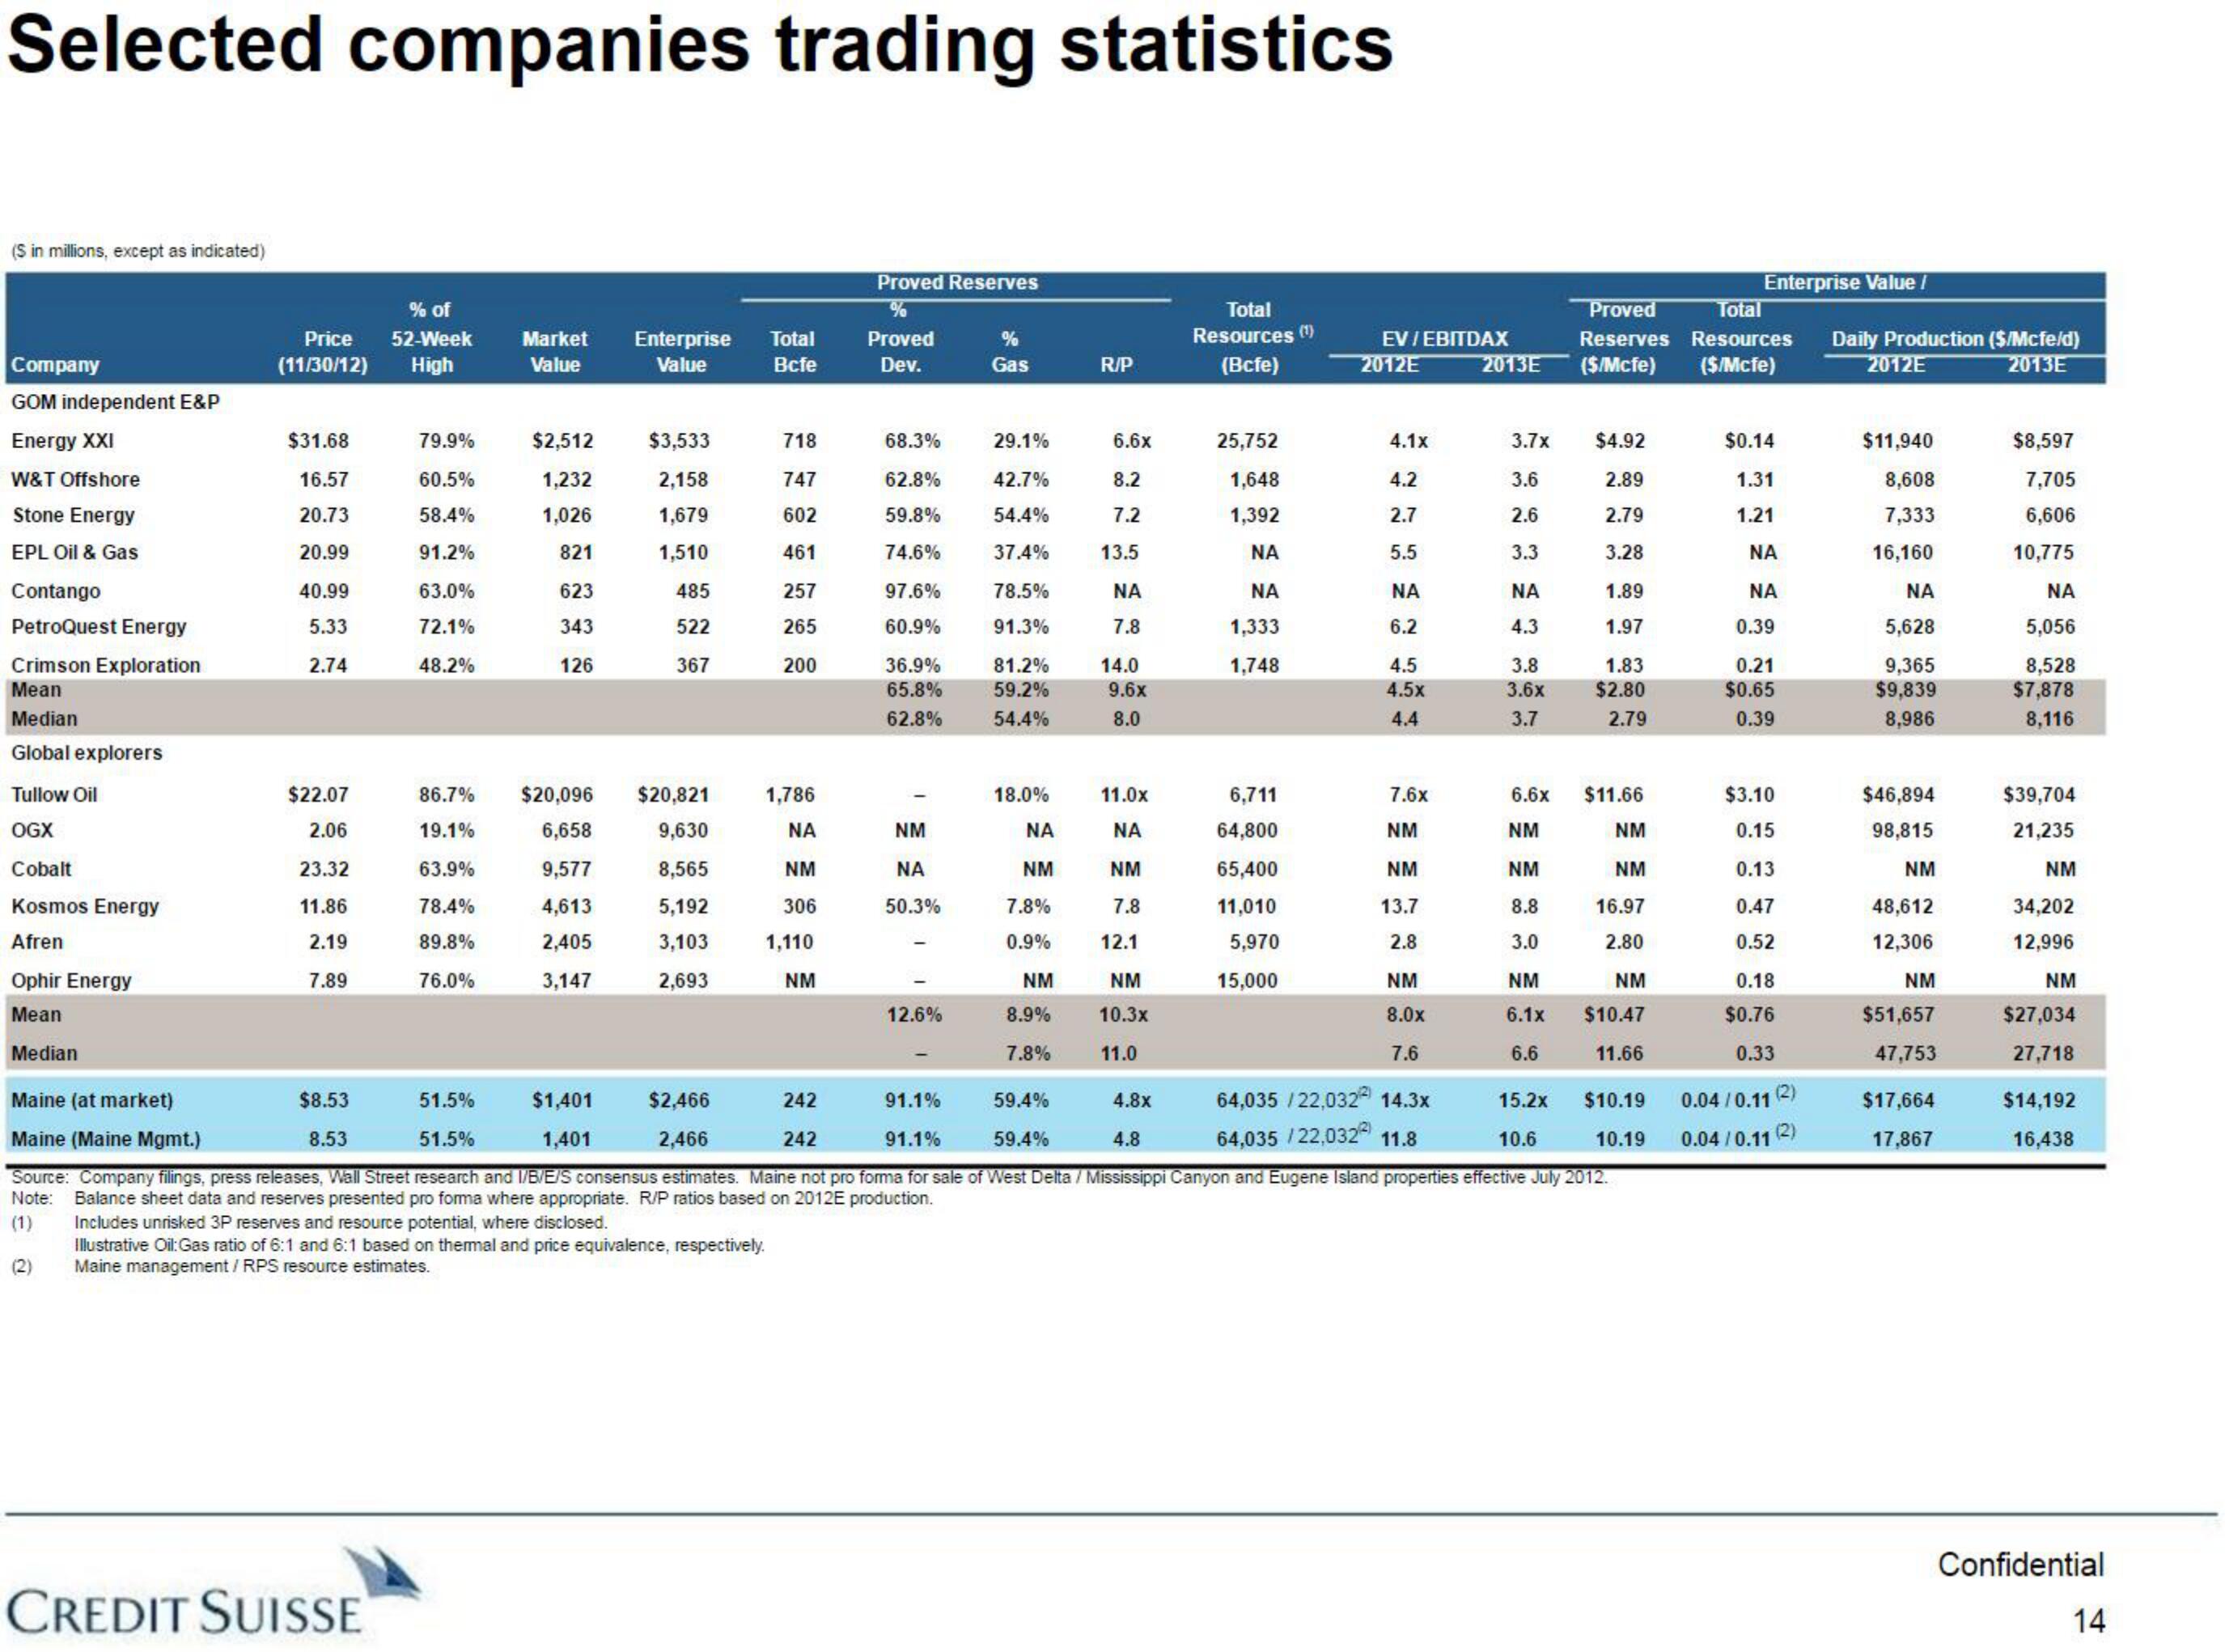
Selected companies trading statistics
(S in millions, except as indicated)
Company
GOM independent E&P
Energy XXI
W&T Offshore
Stone Energy
EPL Oil & Gas
Contango
PetroQuest Energy
Crimson Exploration
Mean
Median
Global explorers
Tullow Oil
OGX
Cobalt
Kosmos Energy
Afren
Ophir Energy
Mean
Median
% of
Price 52-Week
(11/30/12) High
(2)
$31.68
16.57
20.73
20.99
40.99
5.33
2.74
$22.07
2.06
23.32
11.86
2.19
7.89
79.9%
60.5%
58.4%
91.2%
63.0%
72.1%
48.2%
CREDIT SUISSE
Market Enterprise Total
Value
Value
Bcfe
$2,512
1,232
1,026
821
623
343
126
$3,533
2,158
1,679
1,510
485
522
367
86.7% $20,096 $20,821
19.1%
6,658
9,630
63.9%
9,577
8,565
78.4%
4,613
5,192
89.8%
2,405
3,103
76.0%
3,147
2,693
$1,401
1,401
718
747
602
461
257
265
200
1,786
ΝΑ
NM
306
1,110
NM
Proved Reserves
%
Proved
Dev.
68.3%
62.8%
59.8%
74.6%
97.6%
60.9%
36.9%
65.8%
62.8%
NM
ΝΑ
50.3%
12.6%
Gas
29.1%
42.7%
54.4%
37.4%
78.5%
91.3%
81.2%
59.2%
54.4%
18.0%
ΝΑ
NM
7.8%
0.9%
NM
8.9%
7.8%
R/P
6.6x
8.2
7.2
13.5
ΝΑ
7.8
14.0
9.6x
8.0
11.0x
ΝΑ
NM
7.8
12.1
NM
10.3x
11.0
Total
Resources (¹)
(Bcfe)
25,752
1,648
1,392
ΝΑ
ΝΑ
1,333
1,748
6,711
64,800
65,400
11,010
5,970
15,000
EV/EBITDAX
2012E
4.1x
4.2
2.7
5.5
ΝΑ
6.2
4.5
4.5x
4.4
7.6x
NM
NM
13.7
2.8
NM
8.0x
7.6
64,035 /22,032² 14.3x
64,035/22,032 11.8
2013E
3.7x
3.6
2.6
3.3
ΝΑ
4.3
3.8
3.6x
3.7
Maine (at market)
$8.53
51.5%
$2,466
242
4.8x
91.1%
91.1%
59.4%
59.4%
8.53
51.5%
2,466
242
4.8
Maine (Maine Mgmt.)
Source: Company filings, press releases, Wall Street research and I/B/E/S consensus estimates. Maine not pro forma for sale of West Delta / Mississippi Canyon and Eugene Island properties effective July 2012.
Note: Balance sheet data and reserves presented pro forma where appropriate. R/P ratios based on 2012E production.
(1)
Includes unrisked 3P reserves and resource potential, where disclosed.
Illustrative Oil: Gas ratio of 6:1 and 6:1 based on thermal and price equivalence, respectively.
Maine management / RPS resource estimates.
Proved
Total
Reserves Resources Daily Production ($/Mcfe/d)
($/Mcfe) ($/Mcfe)
2012E
2013E
$4.92
2.89
2.79
3.28
1.89
1.97
1.83
$2.80
2.79
6.6x $11.66
NM
NM
NM
NM
8.8
16.97
2.80
3.0
NM
6.1x
6.6
15.2x
10.6
NM
$10.47
11.66
Enterprise Value /
$10.19
10.19
$0.14
1.31
1.21
ΝΑ
ΝΑ
0.39
0.21
$0.65
0.39
$3.10
0.15
0.13
0.47
0.52
0.18
$0.76
0.33
0.04/0.11
0.04/0.11
(2)
(2)
$11,940
8,608
7,333
16,160
ΝΑ
5,628
9,365
$9,839
8,986
$46,894
98,815
NM
48,612
12,306
NM
$51,657
47,753
$17,664
17,867
$8,597
7,705
6,606
10,775
ΝΑ
5,056
8,528
$7,878
8,116
$39,704
21,235
NM
34,202
12,996
NM
$27,034
27,718
$14,192
16,438
Confidential
14View entire presentation