Zegna Results Presentation Deck
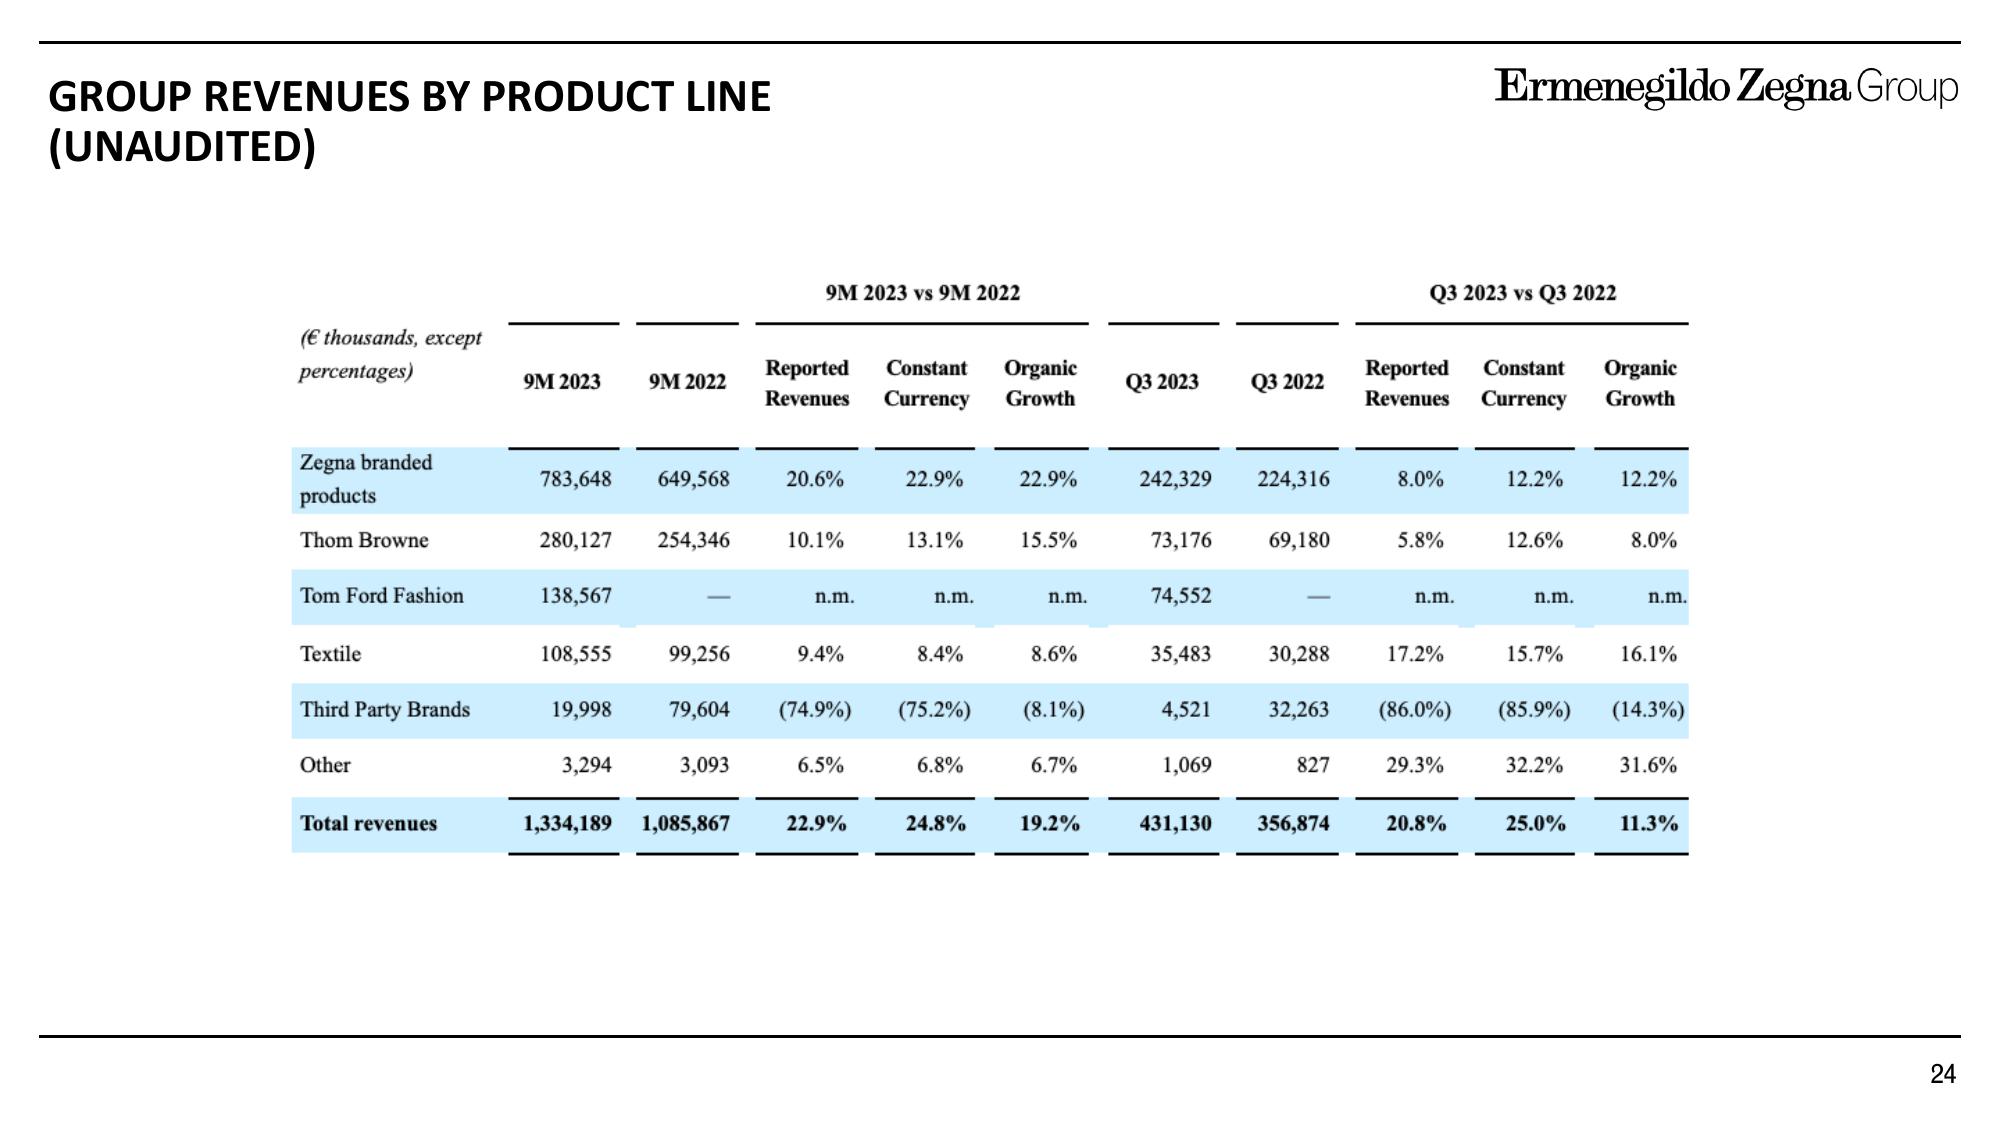
GROUP REVENUES BY PRODUCT LINE
(UNAUDITED)
(€ thousands, except
percentages)
Zegna branded
products
Thom Browne
Tom Ford Fashion
Textile
Third Party Brands
Other
Total revenues
9M 2023
783,648 649,568
280,127 254,346
138,567
108,555
9M 2022
19,998
3,294
99,256
3,093
9M 2023 vs 9M 2022
1,334,189 1,085,867
Reported Constant
Revenues Currency
20.6%
10.1%
n.m.
79,604 (74.9%)
9.4%
6.5%
22.9%
22.9%
13.1%
n.m.
8.4%
6.8%
Organic
Growth
24.8%
22.9%
15.5%
n.m.
(75.2%) (8.1%)
8.6%
6.7%
19.2%
Q3 2023
242,329
73,176
74,552
35,483
4,521
1,069
Q3 2022
224,316
69,180
30,288
32,263
827
431,130 356,874
Q3 2023 vs Q3 2022
Reported Constant Organic
Revenues Currency
Growth
8.0%
5.8%
n.m.
17.2%
Ermenegildo Zegna Group
29.3%
20.8%
12.2%
12.6%
n.m.
(86.0%) (85.9%)
15.7%
32.2%
25.0%
12.2%
8.0%
n.m.
16.1%
(14.3%)
31.6%
11.3%
24View entire presentation