Vivid Seats Results Presentation Deck
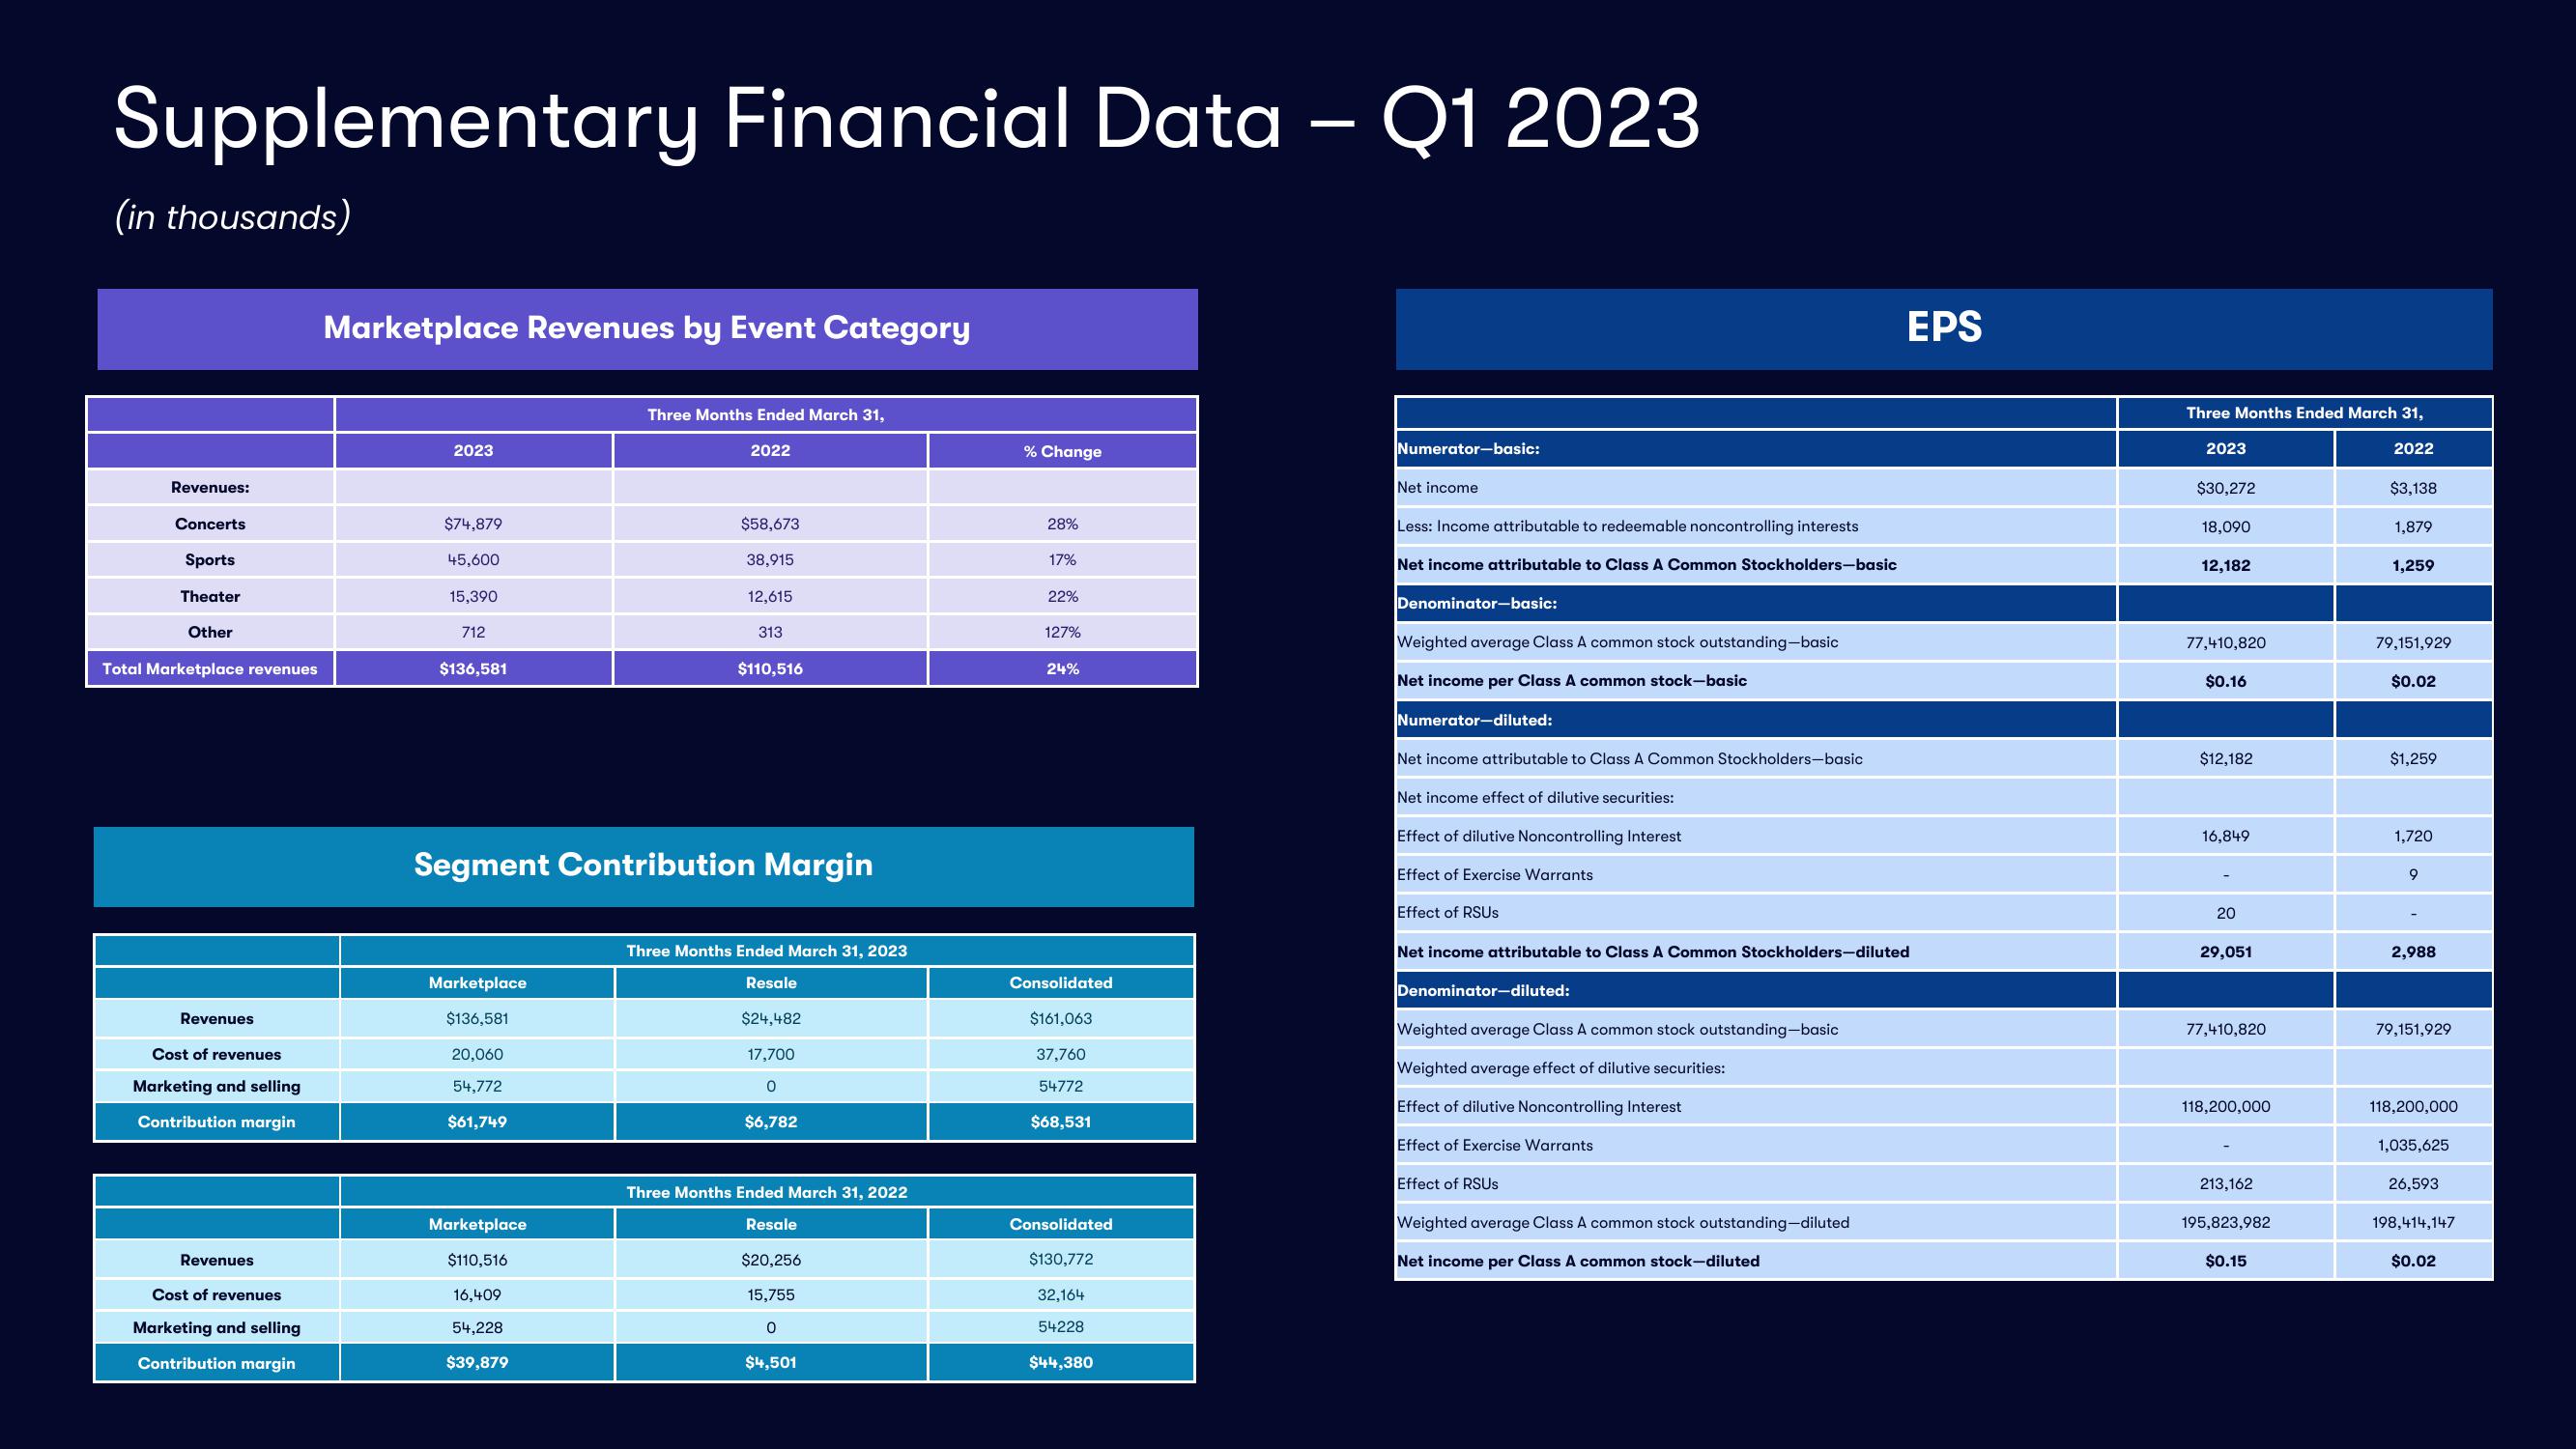
Supplementary Financial Data – Q1 2023
(in thousands)
Revenues:
Concerts
Sports
Theater
Other
Total Marketplace revenues
Revenues
Cost of revenues
Marketing and selling
Contribution margin
Revenues
Cost of revenues
Marketing and selling
Contribution margin
Marketplace Revenues by Event Category
2023
$74,879
45,600
15,390
712
$136,581
Marketplace
$136,581
20,060
54,772
$61,749
Three Months Ended March 31,
Marketplace
$110,516
16,409
54,228
$39,879
2022
Segment Contribution Margin
$58,673
38,915
12,615
313
$110,516
Three Months Ended March 31, 2023
Resale
$24,482
17,700
0
$6,782
Three Months Ended March 31, 2022
Resale
$20,256
15,755
0
$4,501
% Change
28%
17%
22%
127%
24%
Consolidated
$161,063
37,760
54772
$68,531
Consolidated
$130,772
32,164
54228
$44,380
Numerator-basic:
Net income
Less: Income attributable to redeemable noncontrolling interests
Net income attributable to Class A Common Stockholders-basic
Denominator-basic:
Weighted average Class A common stock outstanding-basic
Net income per Class A common stock-basic
Numerator-diluted:
Net income attributable to Class A Common Stockholders-basic
Net income effect of dilutive securities:
Effect of dilutive Noncontrolling Interest
Effect of Exercise Warrants
Effect of RSUS
Net income attributable to Class A Common Stockholders-diluted
Denominator-diluted:
Weighted average Class A common stock outstanding-basic
Weighted average effect of dilutive securities:
Effect of dilutive Noncontrolling Interest
Effect of Exercise Warrants
Effect of RSUS
EPS
Weighted average Class A common stock outstanding-diluted
Net income per Class A common stock-diluted
Three Months Ended March 31,
2023
$30,272
18,090
12,182
77,410,820
$0.16
$12,182
16,849
20
29,051
77,410,820
118,200,000
213,162
195,823,982
$0.15
2022
$3,138
1,879
1,259
79,151,929
$0.02
$1,259
1,720
9
2,988
79,151,929
118,200,000
1,035,625
26,593
198,414,147
$0.02View entire presentation