UBS Results Presentation Deck
Personal & Corporate Banking (CHF)
CHF m, except where indicated
Total revenues
Net interest income
Recurring net fee income
Transaction-based income
Other income
Credit loss expense / (release)
Operating expenses
Profit before tax
Cost / income ratio
Deposits, bn
Loans, bn
UBS
3Q23
underlying
2,159
1,189
431
507
31
154
1,232
773
57%
269
288
3Q23
reported
2,556
1,550
431
543
31
154
1,405
997
55%
269
288
3Q23 underlying vs 2Q23 estimated underlying
CHF bn
Total
revenues
CLE
Operating
expenses
Profit
before
tax
2.1
0.2
1.2
0.7
2Q23
2.2
0.2
1.2
0.8
3Q23
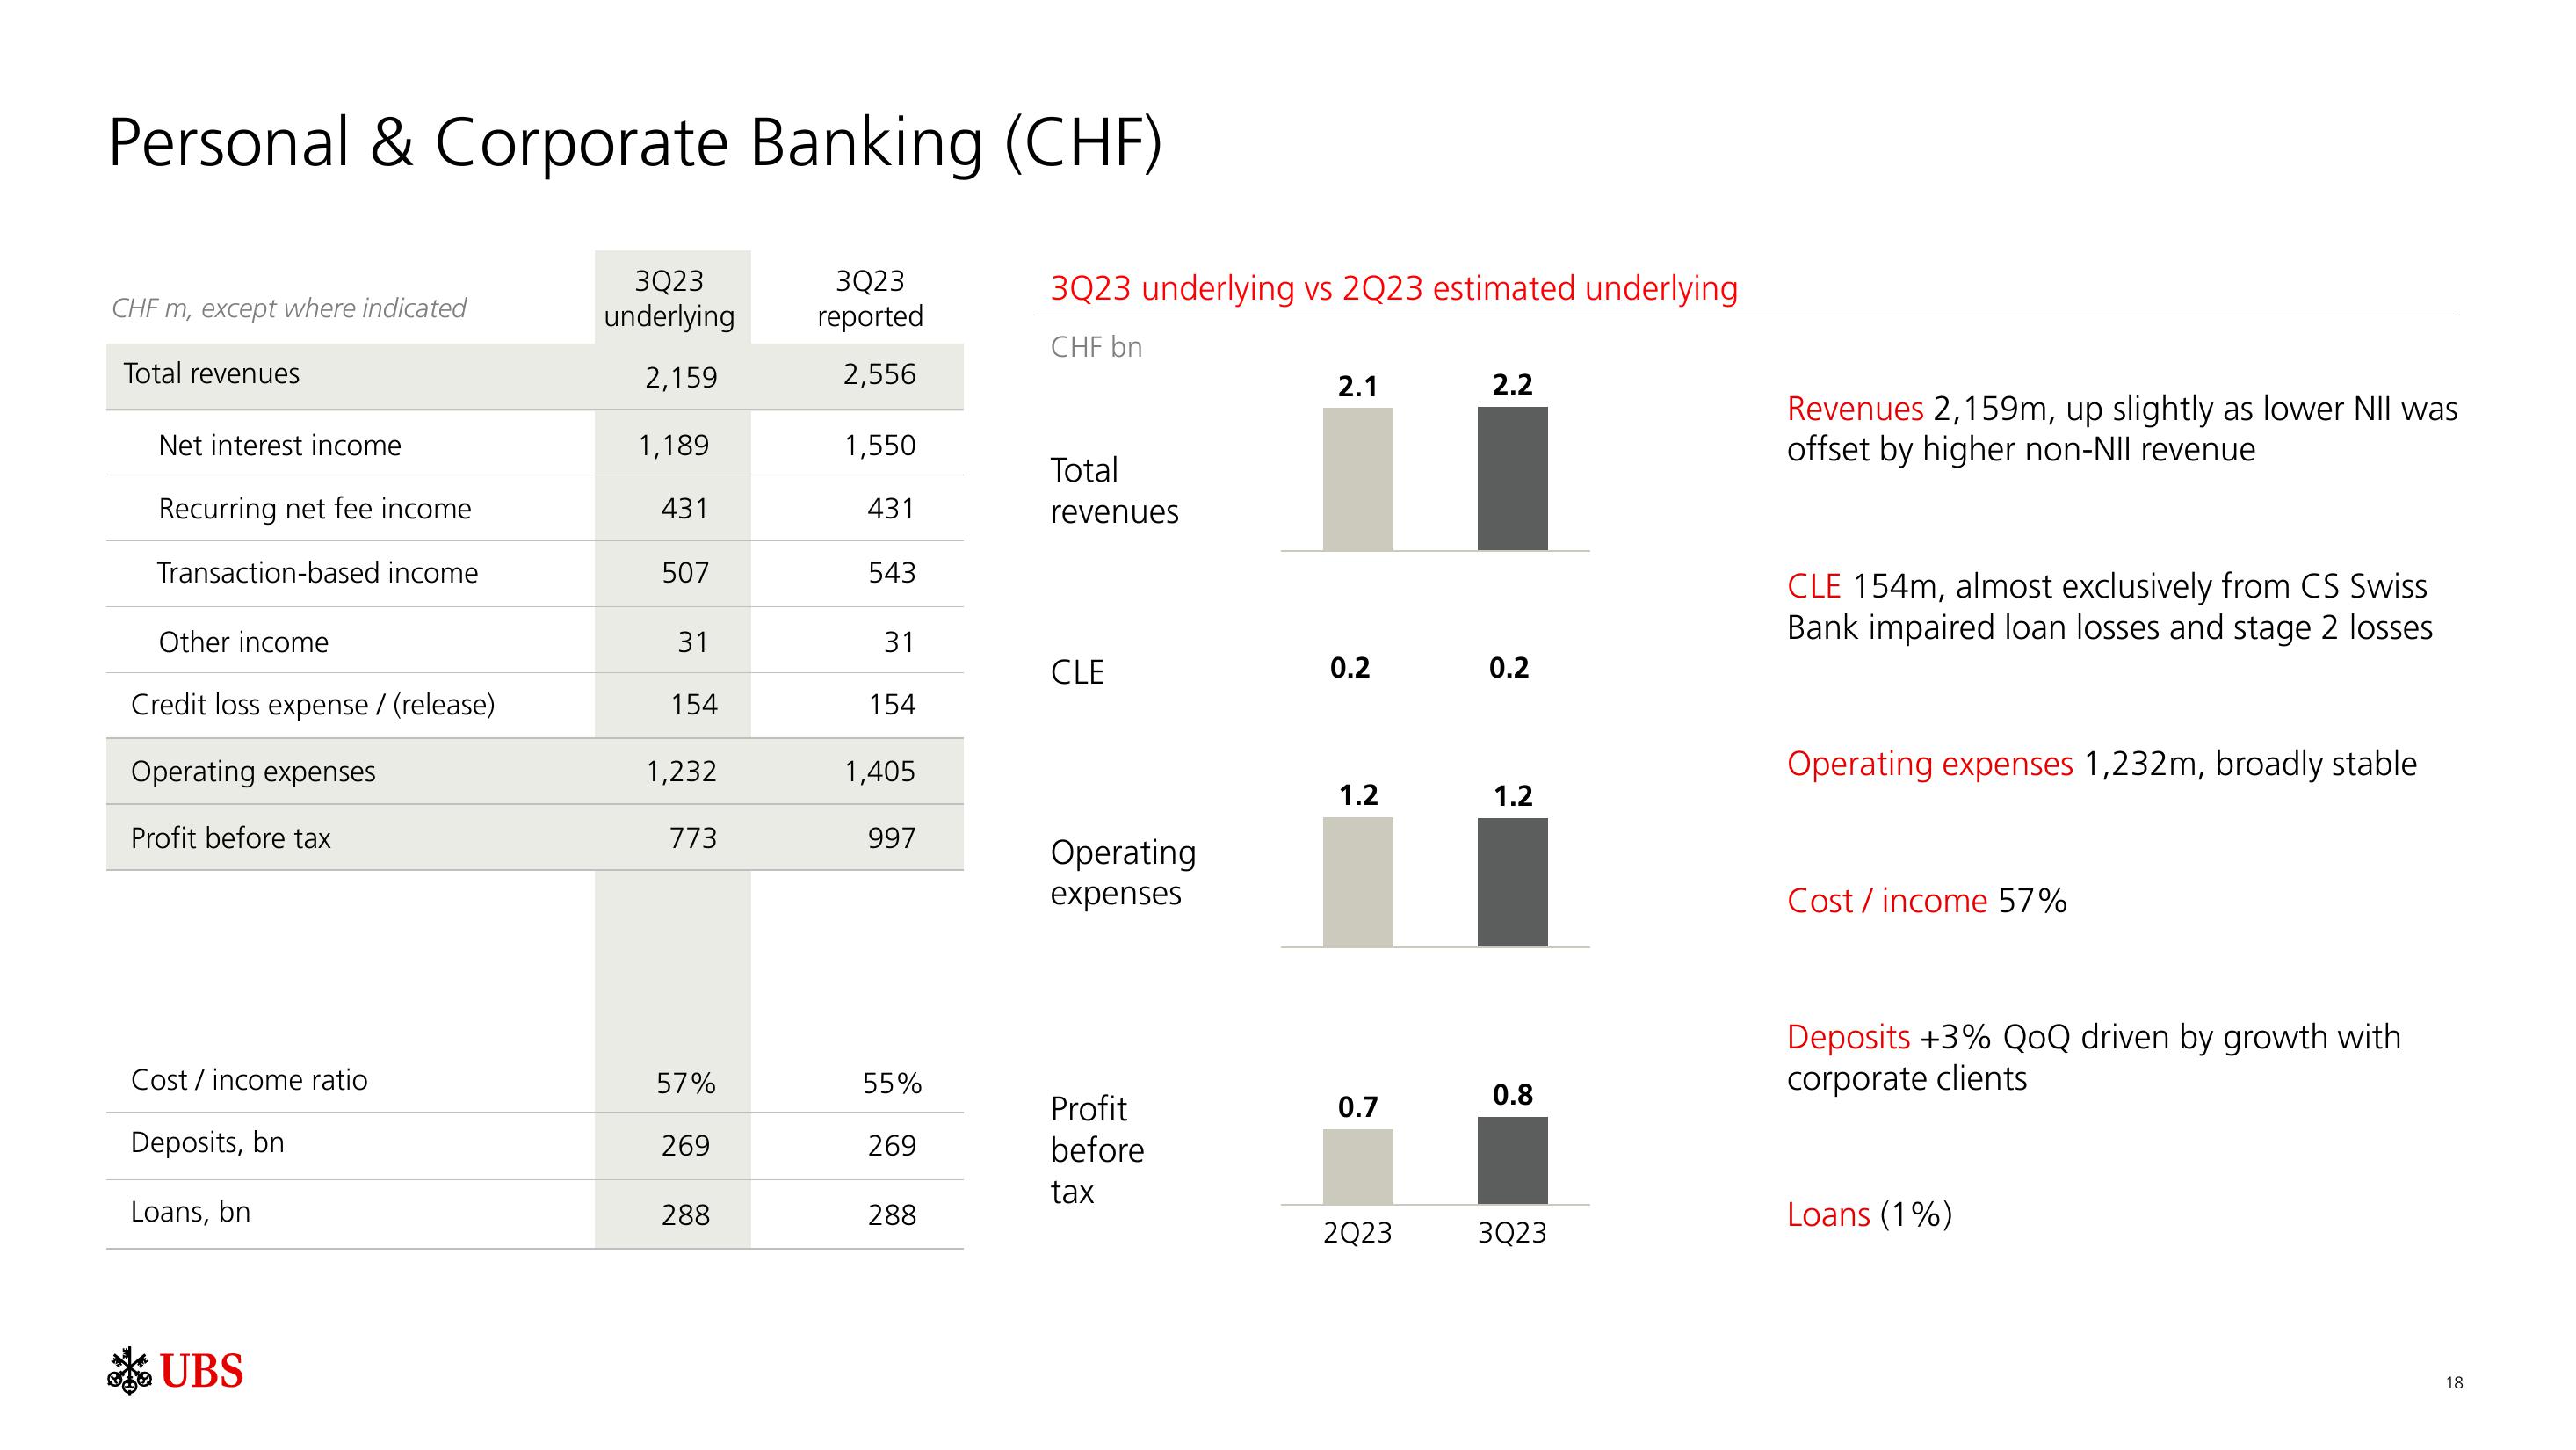
Revenues 2,159m, up slightly as lower NII was
offset by higher non-NII revenue
CLE 154m, almost exclusively from CS Swiss
Bank impaired loan losses and stage 2 losses
Operating expenses 1,232m, broadly stable
Cost/income 57%
Deposits +3% QOQ driven by growth with
corporate clients
Loans (1%)
18View entire presentation