Deutsche Bank Results Presentation Deck
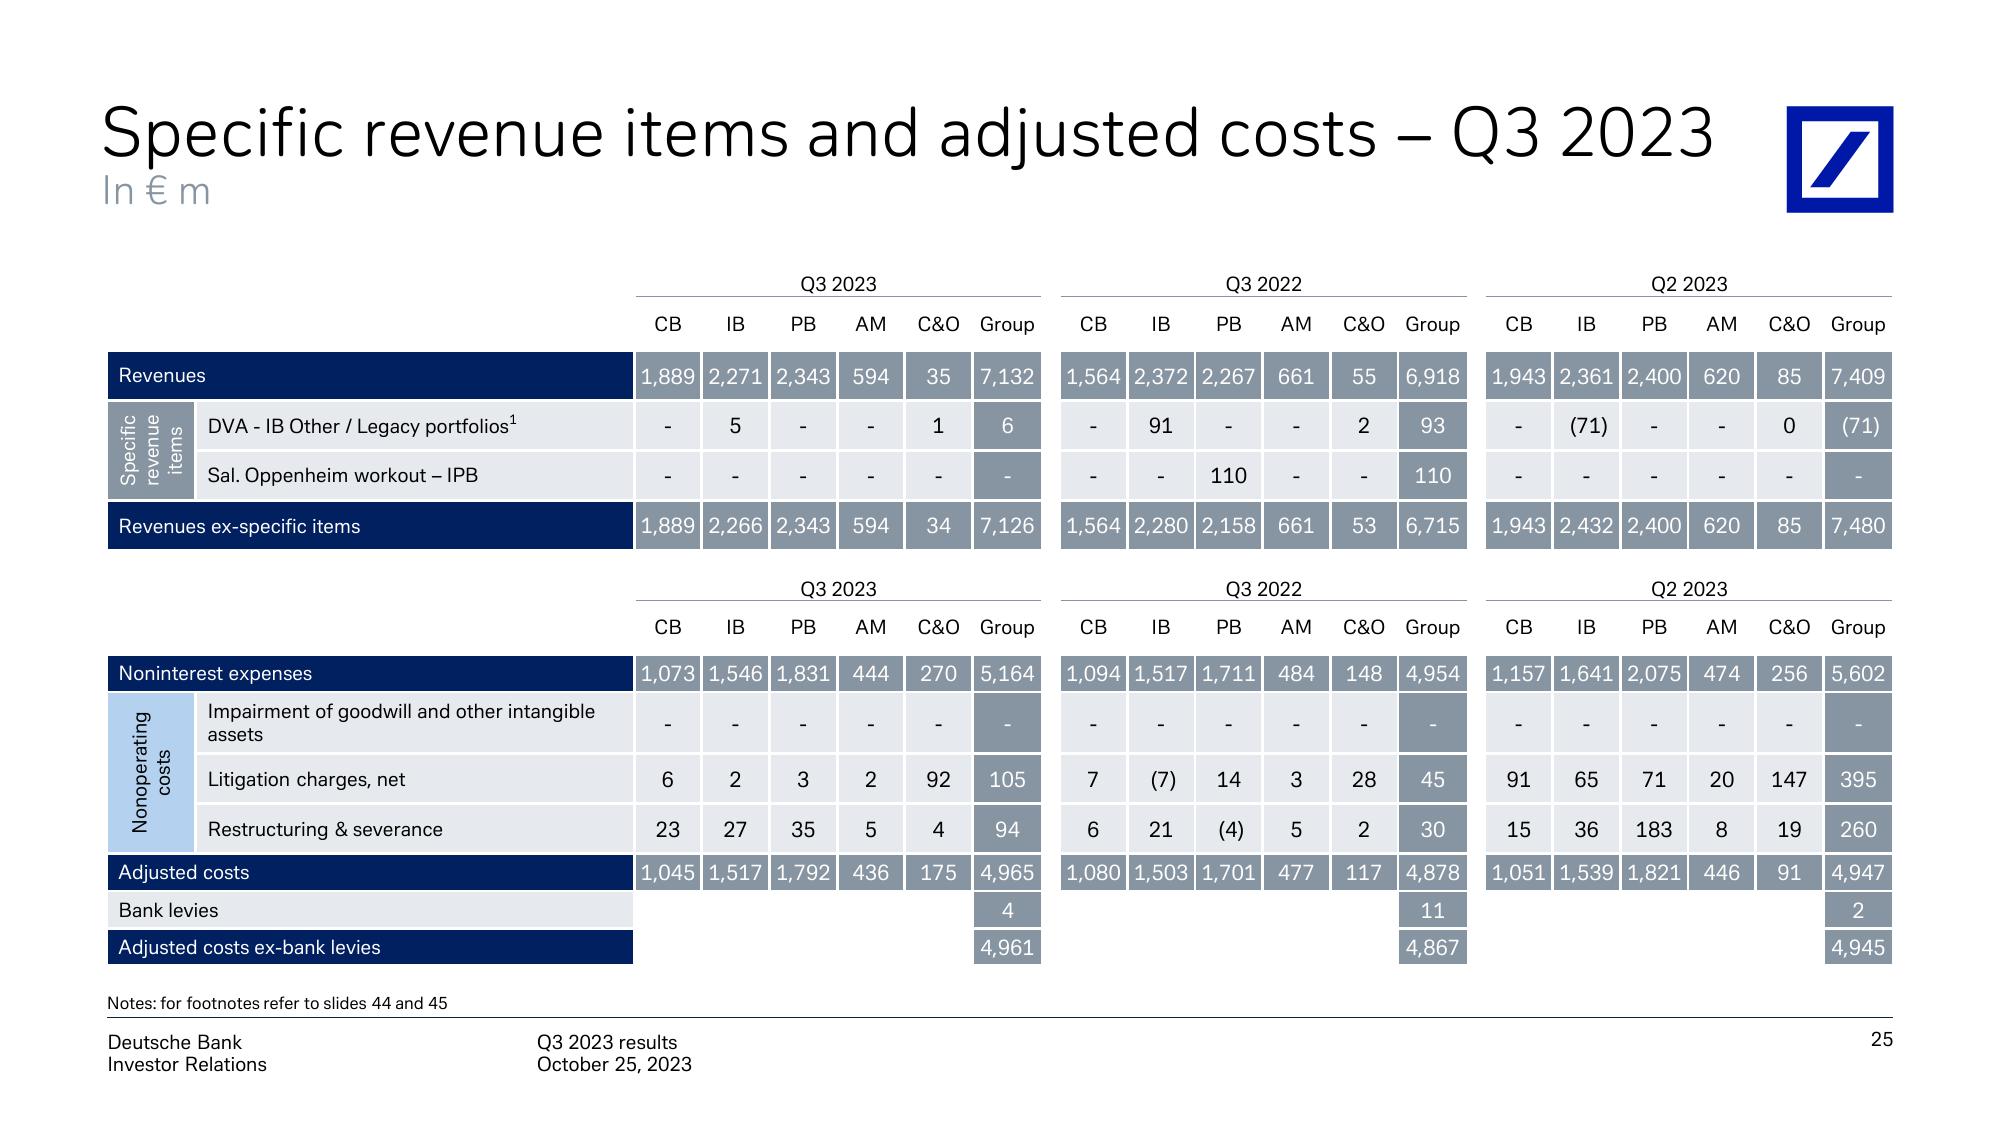
Specific revenue items and adjusted costs -
costs - Q3 2023
In € m
Revenues
Specific
revenue
items
DVA - IB Other / Legacy portfolios¹
Sal. Oppenheim workout - IPB
Revenues ex-specific items
Noninterest expenses
Nonoperating
costs
Impairment of goodwill and other intangible
assets
Litigation charges, net
Restructuring & severance
Adjusted costs
Bank levies
Adjusted costs ex-bank levies
Notes: for footnotes refer to slides 44 and 45
Deutsche Bank
Investor Relations
CB
1,889 2,271 2,343 594 35
1
CB
IB
"
1,889 2,266 2,343 594
6
5
Q3 2023
PB AM
1,073 1,546 1,831 444
Q3 2023 results
October 25, 2023
Q3 2023
PB AM
IB
2
I
3
I
C&O Group
2
34
7,132
92
23
27
35
5
4
1,045 1,517 1,792 436 175
6
C&O Group
7,126
270 5,164
105
94
4,965
4
4,961
CB
IB
1
Q3 2022
PB AM C&O Group
91
1,564 2,372 2,267 661 55 6,918 1,943 2,361 2,400 620
93
(71)
7
110
1,564 2,280 2,158 661
-
Q3 2022
CB IB PB AM
1,094 1,517 1,711 484
1
14
(7)
6 21 (4) 5
1,080 1,503 1,701 477
3
01
2
C&O Group
110
148 4,954
1
28
2
117
CB
53 6,715 1,943 2,432 2,400 620
45
30
4,878
11
4,867
I
IB
I
I
Q2 2023
PB AM
CB IB
Q2 2023
PB AM
1,157 1,641 2,075 474
91 65 71
15 36 183 8
1,051 1,539 1,821 446
20
/
C&O Group
85
7,409
0 (71)
85 7,480
C&O Group
256 5,602
147 395
19
91
260
4,947
2
4,945
25View entire presentation