UBS Results Presentation Deck
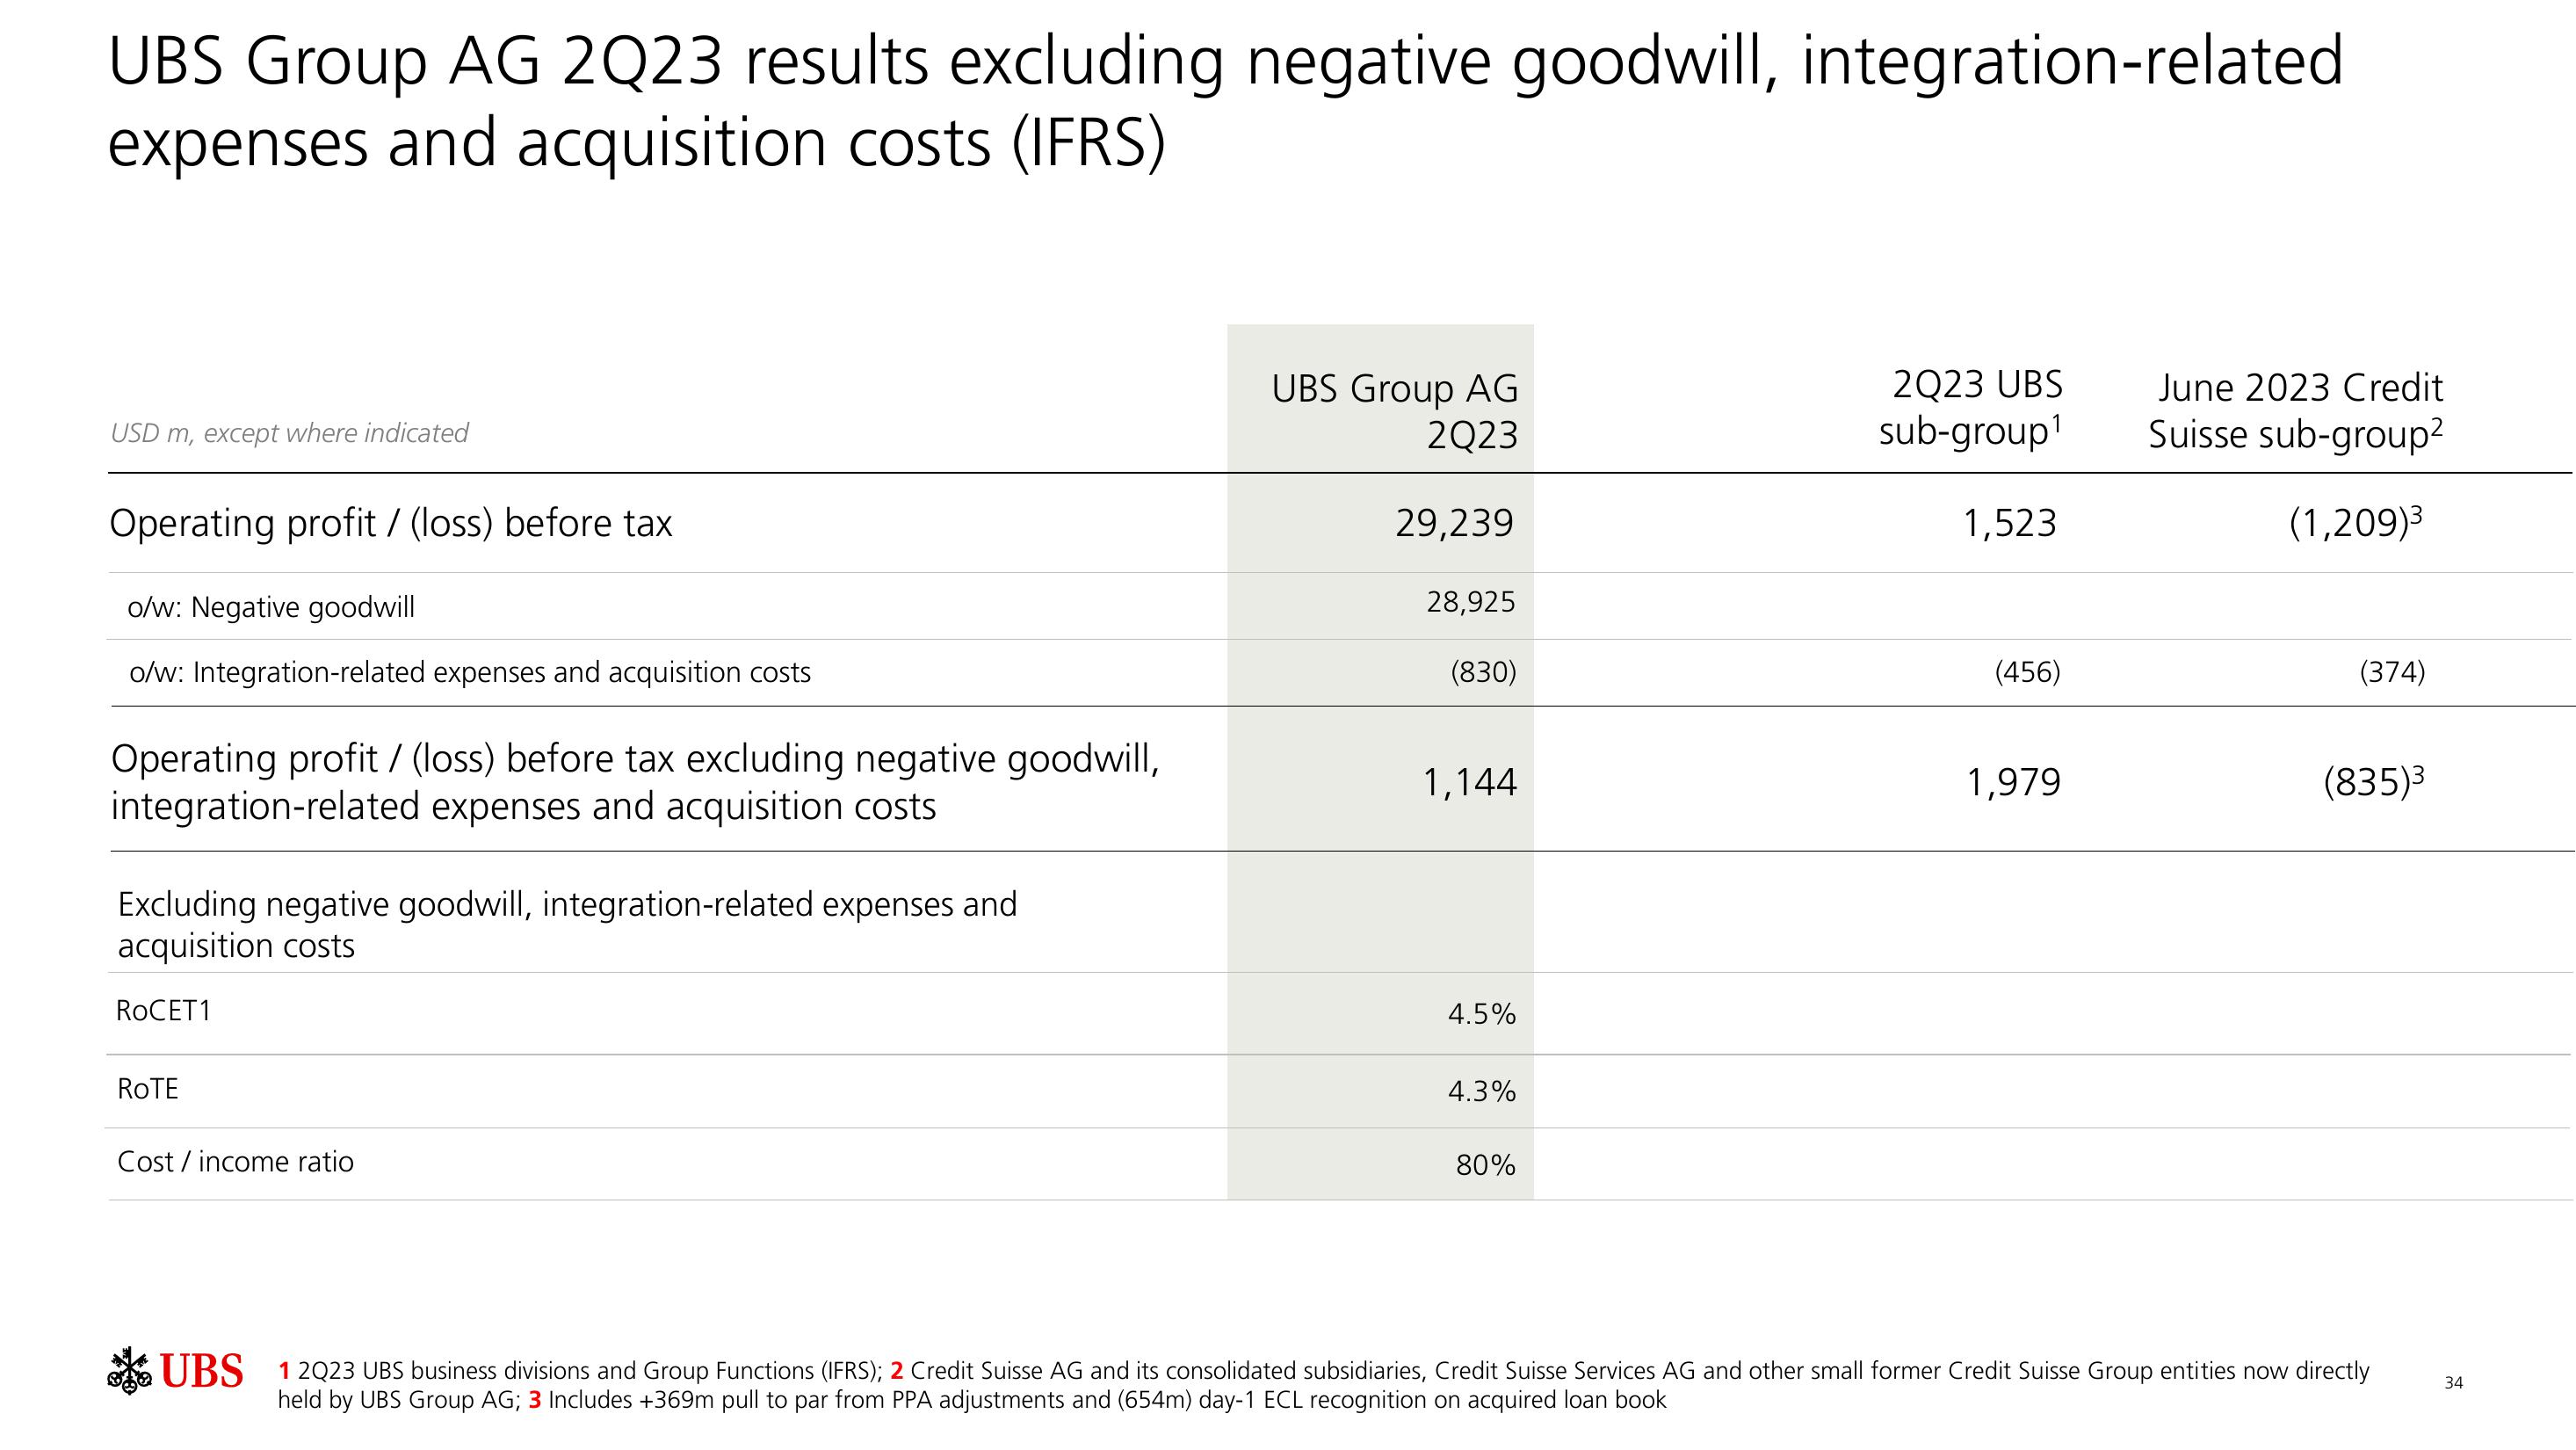
UBS Group AG 2Q23 results excluding negative goodwill, integration-related
expenses and acquisition costs (IFRS)
USD m, except where indicated
Operating profit / (loss) before tax
o/w: Negative goodwill
o/w: Integration-related expenses and acquisition costs
Operating profit / (loss) before tax excluding negative goodwill,
integration-related expenses and acquisition costs
Excluding negative goodwill, integration-related expenses and
acquisition costs
RoCET1
ROTE
Cost/income ratio
UBS Group AG
2Q23
29,239
28,925
(830)
1,144
4.5%
4.3%
80%
2Q23 UBS
sub-group¹
1,523
(456)
1,979
June 2023 Credit
Suisse sub-group²
(1,209)³
(374)
(835)³
UBS 12023 UBS business divisions and Group Functions (IFRS); 2 Credit Suisse AG and its consolidated subsidiaries, Credit Suisse Services AG and other small former Credit Suisse Group entities now directly
held by UBS Group AG; 3 Includes +369m pull to par from PPA adjustments and (654m) day-1 ECL recognition on acquired loan book
34View entire presentation