First Busey Results Presentation Deck
2Q23 Earnings Investor Presentation
First Busey Corporation | Ticker: BUSE
Overview of First Busey Corporation (NASDAQ: BUSE)
155+
Busey
WEALTH MANAGEMENT
WEALTH"
MANAGEMENT
$ in millions
Total Assets
Total Loans
Total Deposits
Total Equity
BuseyBANK
Business | Wealth Management | Personal
Financial Highlights
COMMERCIAL BANKING
Adj. PPNR ROAA
Adj. ROAA
Adj. ROATCE
NPA/Assets
Net Interest Margin
1
1
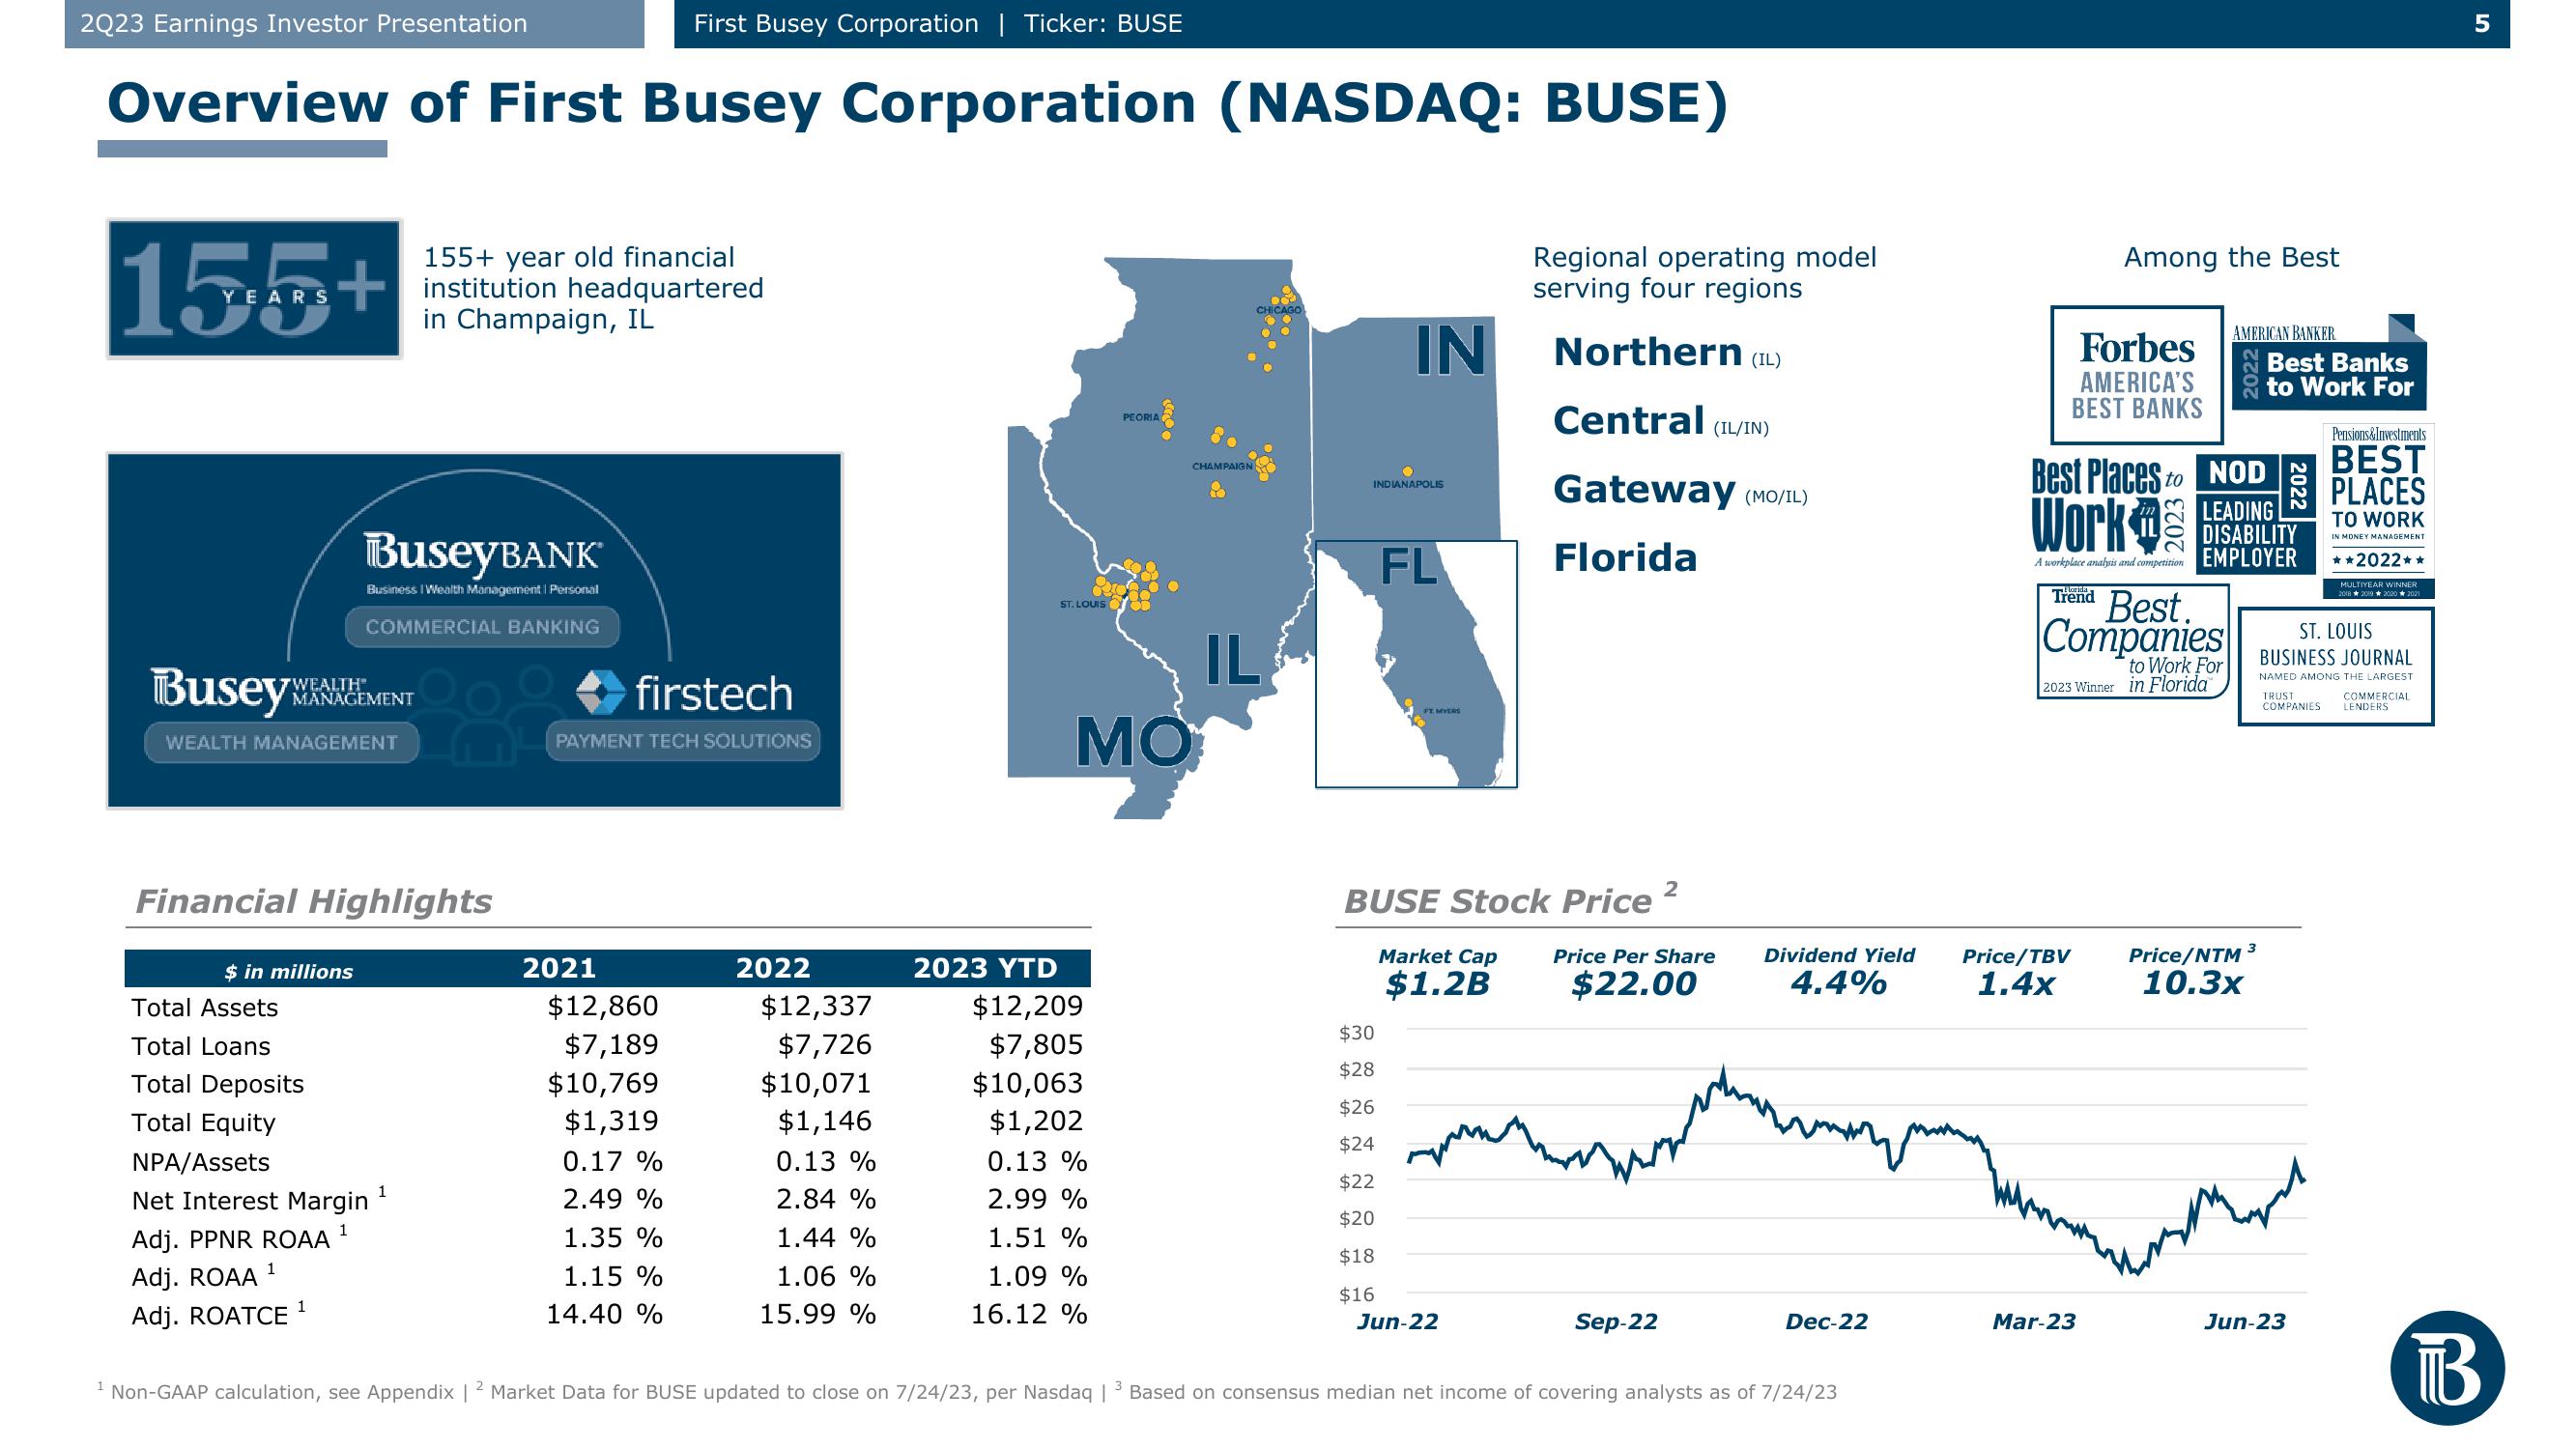
155+ year old financial
institution headquartered
in Champaign, IL
1
firstech
PAYMENT TECH SOLUTIONS
2021
$12,860
$7,189
$10,769
$1,319
0.17 %
2.49 %
1.35 %
1.15 %
14.40 %
2022
$12,337
$7,726
$10,071
$1,146
0.13%
2.84 %
1.44 %
1.06 %
15.99 %
2023 YTD
ST. LOUIS
$12,209
$7,805
$10,063
$1,202
PEORIA
0.13 %
2.99 %
1.51 %
1.09 %
16.12 %
CHAMPAIGN
ΜΟΥ
IL
IN
INDIANAPOLIS
$30
$28
$26
$24
$22
$20
$18
$16
FL
FT MYERS
BUSE Stock Price
Market Cap
$1.2B
Regional operating model
serving four regions
Northern (IL)
Central (IL/IN)
Gateway (MO/IL)
Florida
Jun-22
2
Price Per Share
$22.00
www
Sep-22
Dividend Yield
4.4%
Dec-22
¹ Non-GAAP calculation, see Appendix | 2 Market Data for BUSE updated to close on 7/24/23, per Nasdaq | Based on consensus median net income of covering analysts as of 7/24/23
Among the Best
Forbes
AMERICA'S
BEST BANKS
Price/TBV
1.4x
Best Places
NOD
Work
LEADING
DISABILITY
A workplace analysis and competition EMPLOYER
Trend
Best.
Companies
to Work For
2023 Winner in Florida
Mar-23
to
AMERICAN BANKER
Best Banks
to Work For
Price/NTM 3
10.3x
2022
Jun-23
Pensions&Investments
BEST
PLACES
TO WORK
IN MONEY MANAGEMENT
ST. LOUIS
BUSINESS JOURNAL
NAMED AMONG THE LARGEST
TRUST
COMPANIES
**2022**
MULTIYEAR WINNER
2018 2019 2020 2021
COMMERCIAL
LENDERS
5
BView entire presentation