sndl Investor Presentation slide image

sndl Investor Presentation

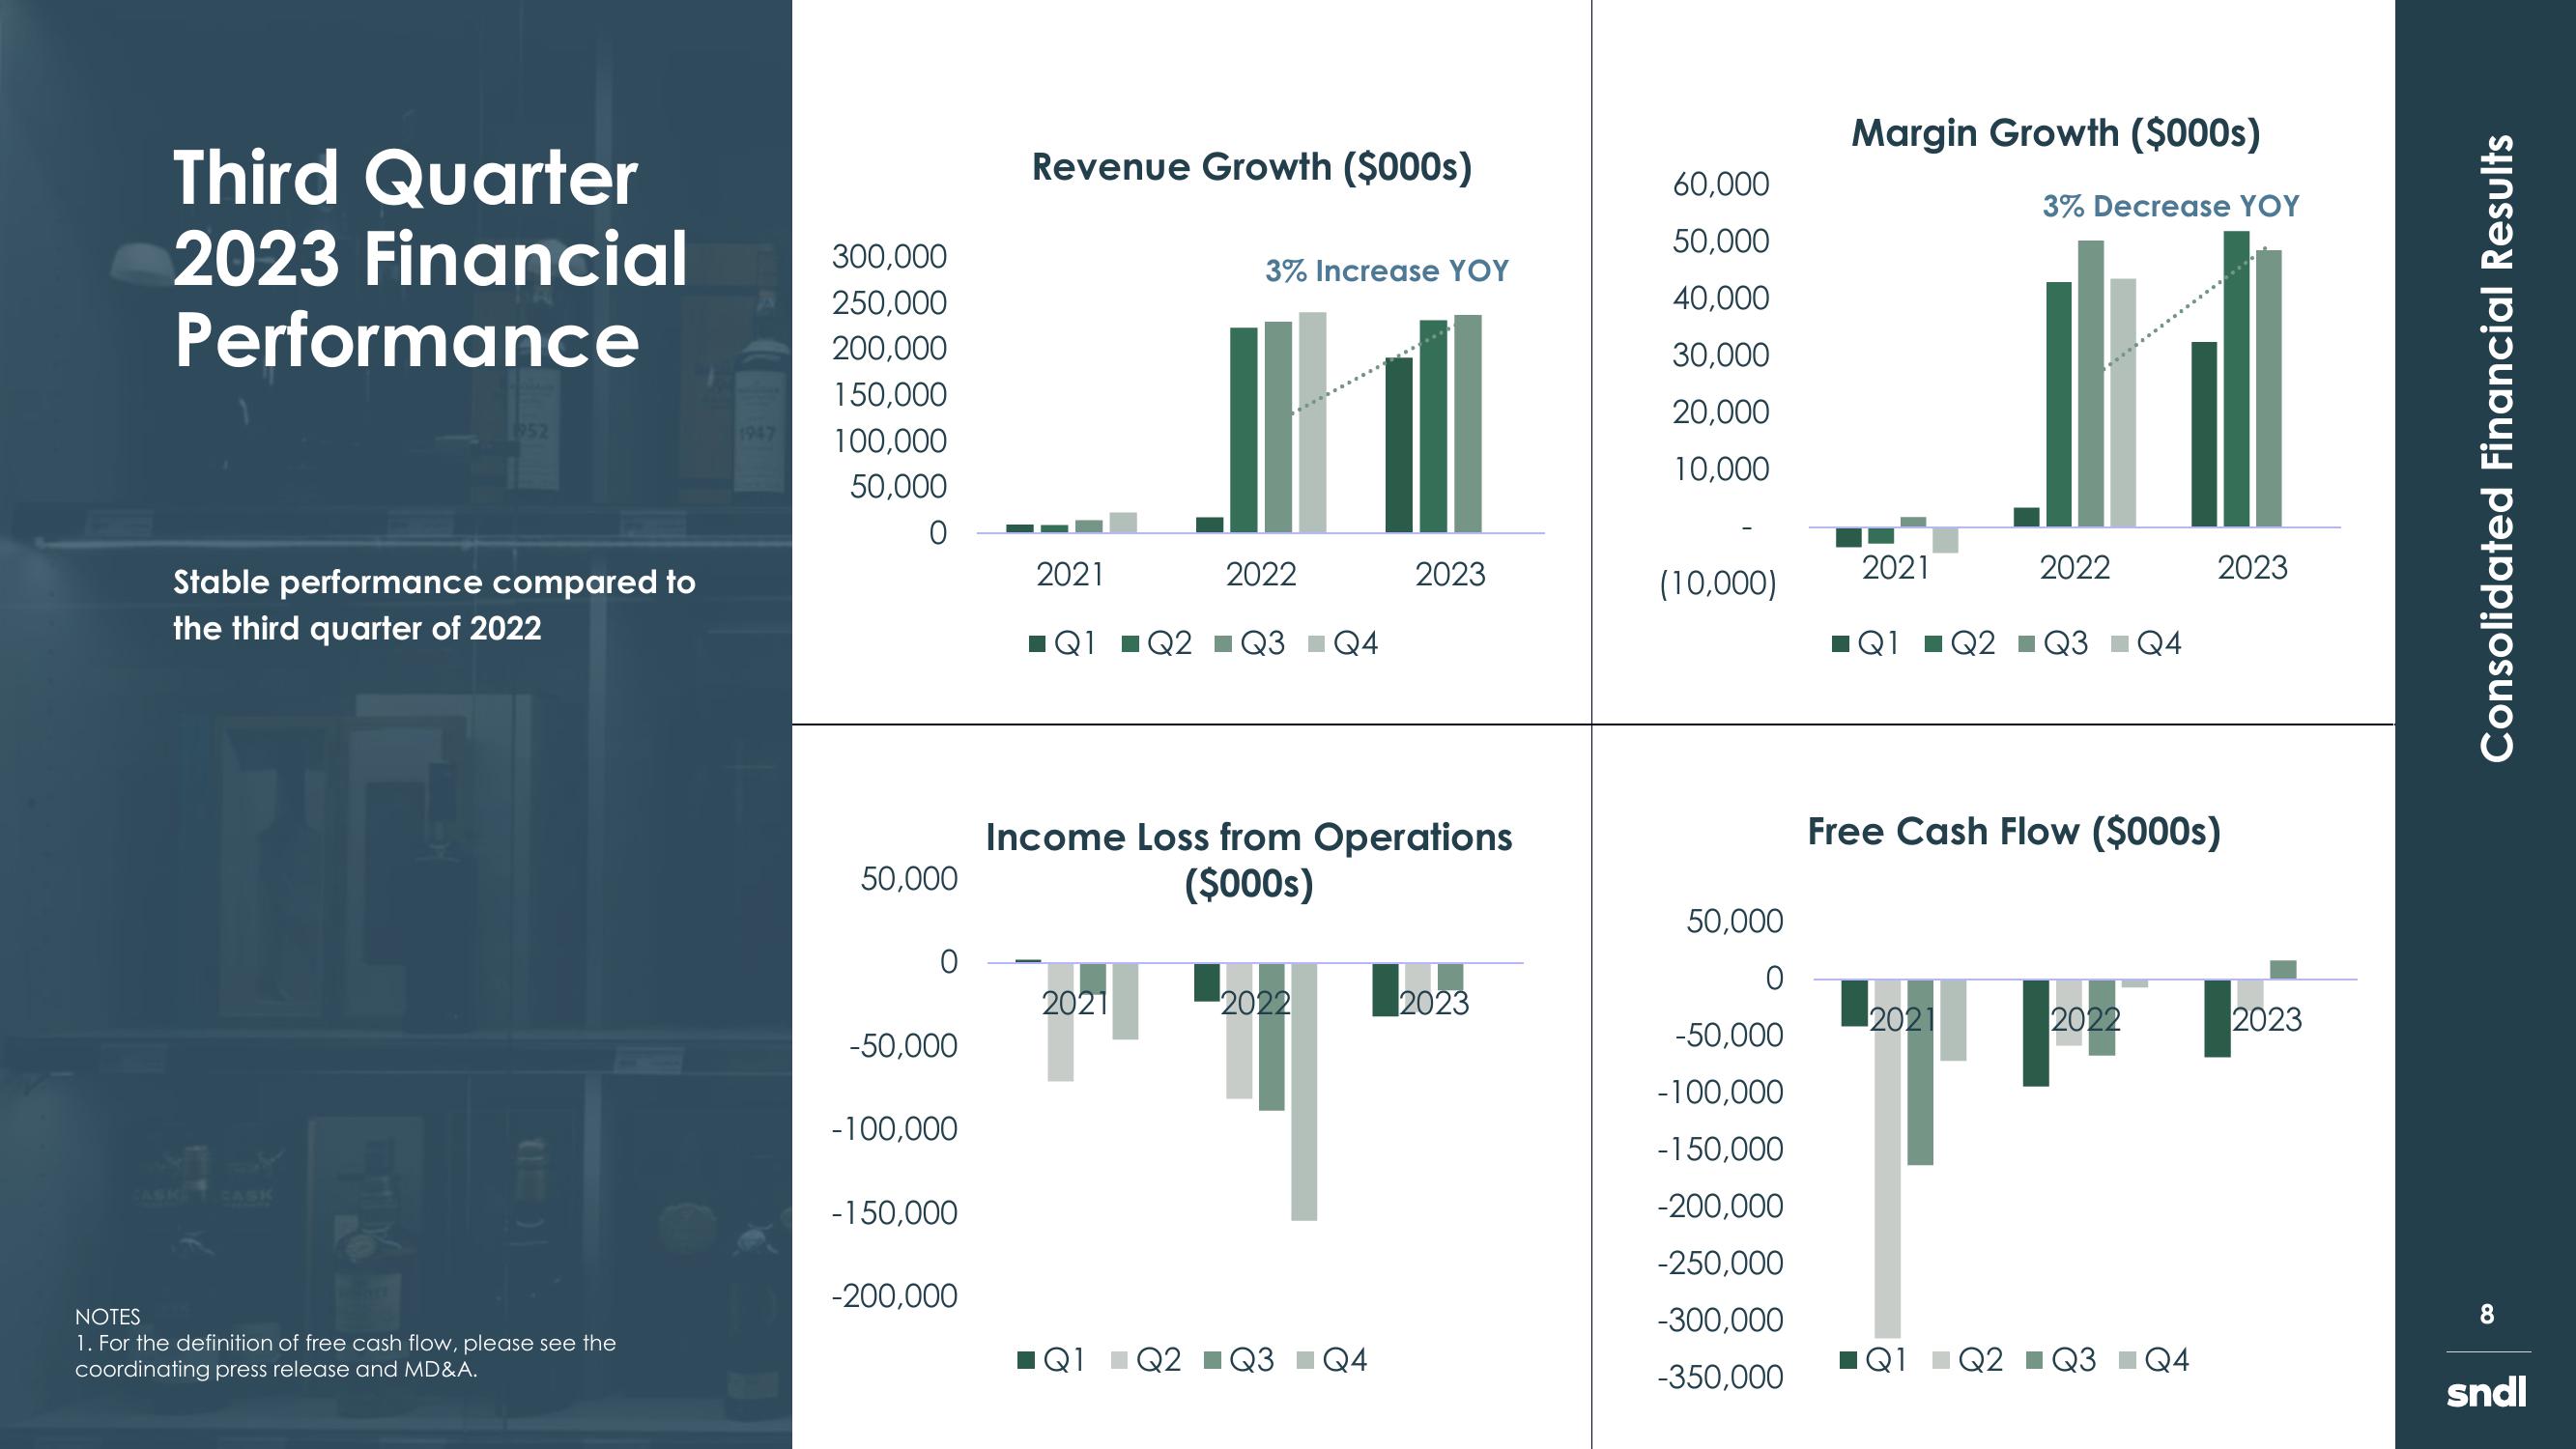
Third Quarter 2023 Financial Performance Stable performance compared to the third quarter of 2022 NOTES 1. For the definition of free cash flow, please see the coordinating press release and MD&A. 300,000 250,000 200,000 150,000 100,000 50,000 O 50,000 O -50,000 -100,000 -150,000 -200,000 Revenue Growth ($000s) 2021 Q1 3% Increase YOY 2021 2022 Q2 Q3 Q4 Income Loss from Operations ($000s) 2022 2023 Q1 Q2 Q3 Q4 2023 60,000 50,000 40,000 30,000 20,000 10,000 (10,000) 50,000 0 -50,000 -100,000 - 150,000 -200,000 -250,000 -300,000 -350,000 Margin Growth ($000s) 3% Decrease YOY H 2021 2022 ■Q1 Q2 Q3 Q4 2021 Free Cash Flow ($000s) 2022 2023 Q1 Q2 Q3 Q4 2023 Consolidated Financial Results 8 sndl
View entire presentation