TPG Results Presentation Deck
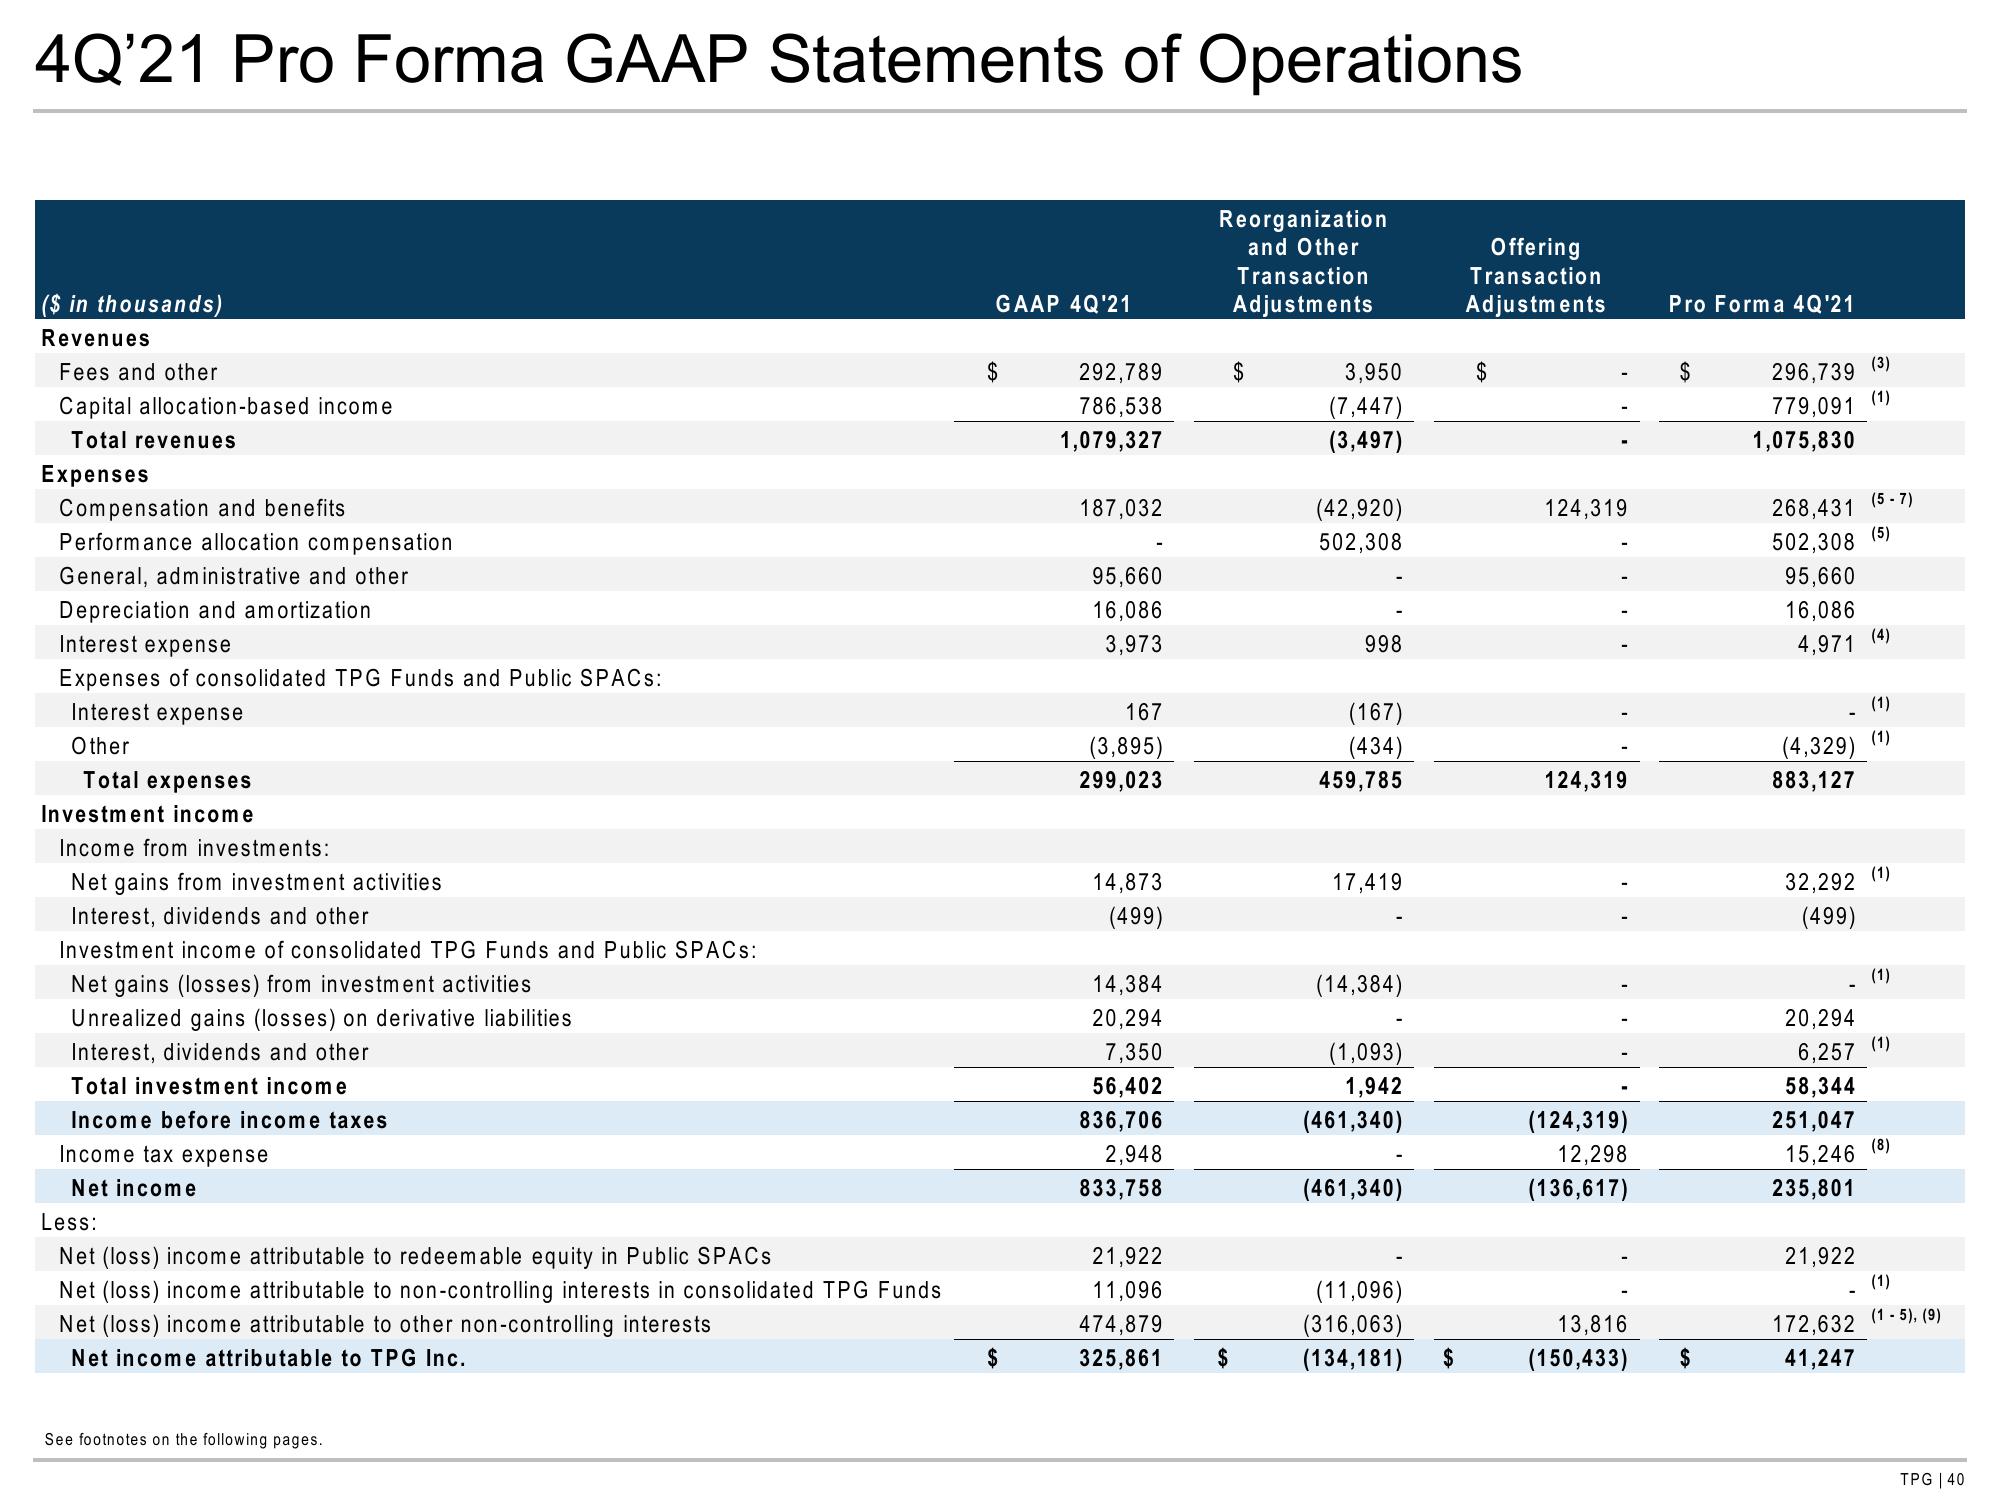
4Q'21 Pro Forma GAAP Statements of Operations
($ in thousands)
Revenues
Fees and other
Capital allocation-based income
Total revenues
Expenses
Compensation and benefits
Performance allocation compensation
General, administrative and other
Depreciation and amortization
Interest expense
Expenses of consolidated TPG Funds and Public SPACs:
Interest expense
Other
Total expenses
Investment income
Income from investments:
Net gains from investment activities
Interest, dividends and other
Investment income of consolidated TPG Funds and Public SPACs:
Net gains (losses) from investment activities
Unrealized gains (losses) on derivative liabilities
Interest, dividends and other
Total investment income
Income before income taxes
Income tax expense
Net income
Less:
Net (loss) income attributable to redeemable equity in Public SPACS
Net (loss) income attributable to non-controlling interests in consolidated TPG Funds
Net (loss) income attributable to other non-controlling interests
Net income attributable to TPG Inc.
See footnotes on the following pages.
GAAP 4Q'21
$
$
292,789
786,538
1,079,327
187,032
95,660
16,086
3,973
167
(3,895)
299,023
14,873
(499)
14,384
20,294
7,350
56,402
836,706
2,948
833,758
21,922
11,096
474,879
325,861
Reorganization
and Other
Transaction
Adjustments
$
$
3,950
(7,447)
(3,497)
(42,920)
502,308
998
(167)
(434)
459,785
17,419
(14,384)
(1,093)
1,942
(461,340)
(461,340)
(11,096)
(316,063)
(134,181) $
Offering
Transaction
Adjustments
$
124,319
124,319
(124,319)
12,298
(136,617)
Pro Forma 4Q'21
$
13,816
(150,433) $
296,739
779,091
1,075,830
268,431
502,308 (5)
95,660
16,086
4,971
32,292
(499)
20,294
6,257
58,344
251,047
15,246
235,801
(3)
(1)
(1)
(4,329) (1)
883,127
21,922
(5-7)
172,632
41,247
(4)
(1)
(1)
(1)
(8)
(1)
(1-5), (9)
TPG | 40View entire presentation