LSE Mergers and Acquisitions Presentation Deck
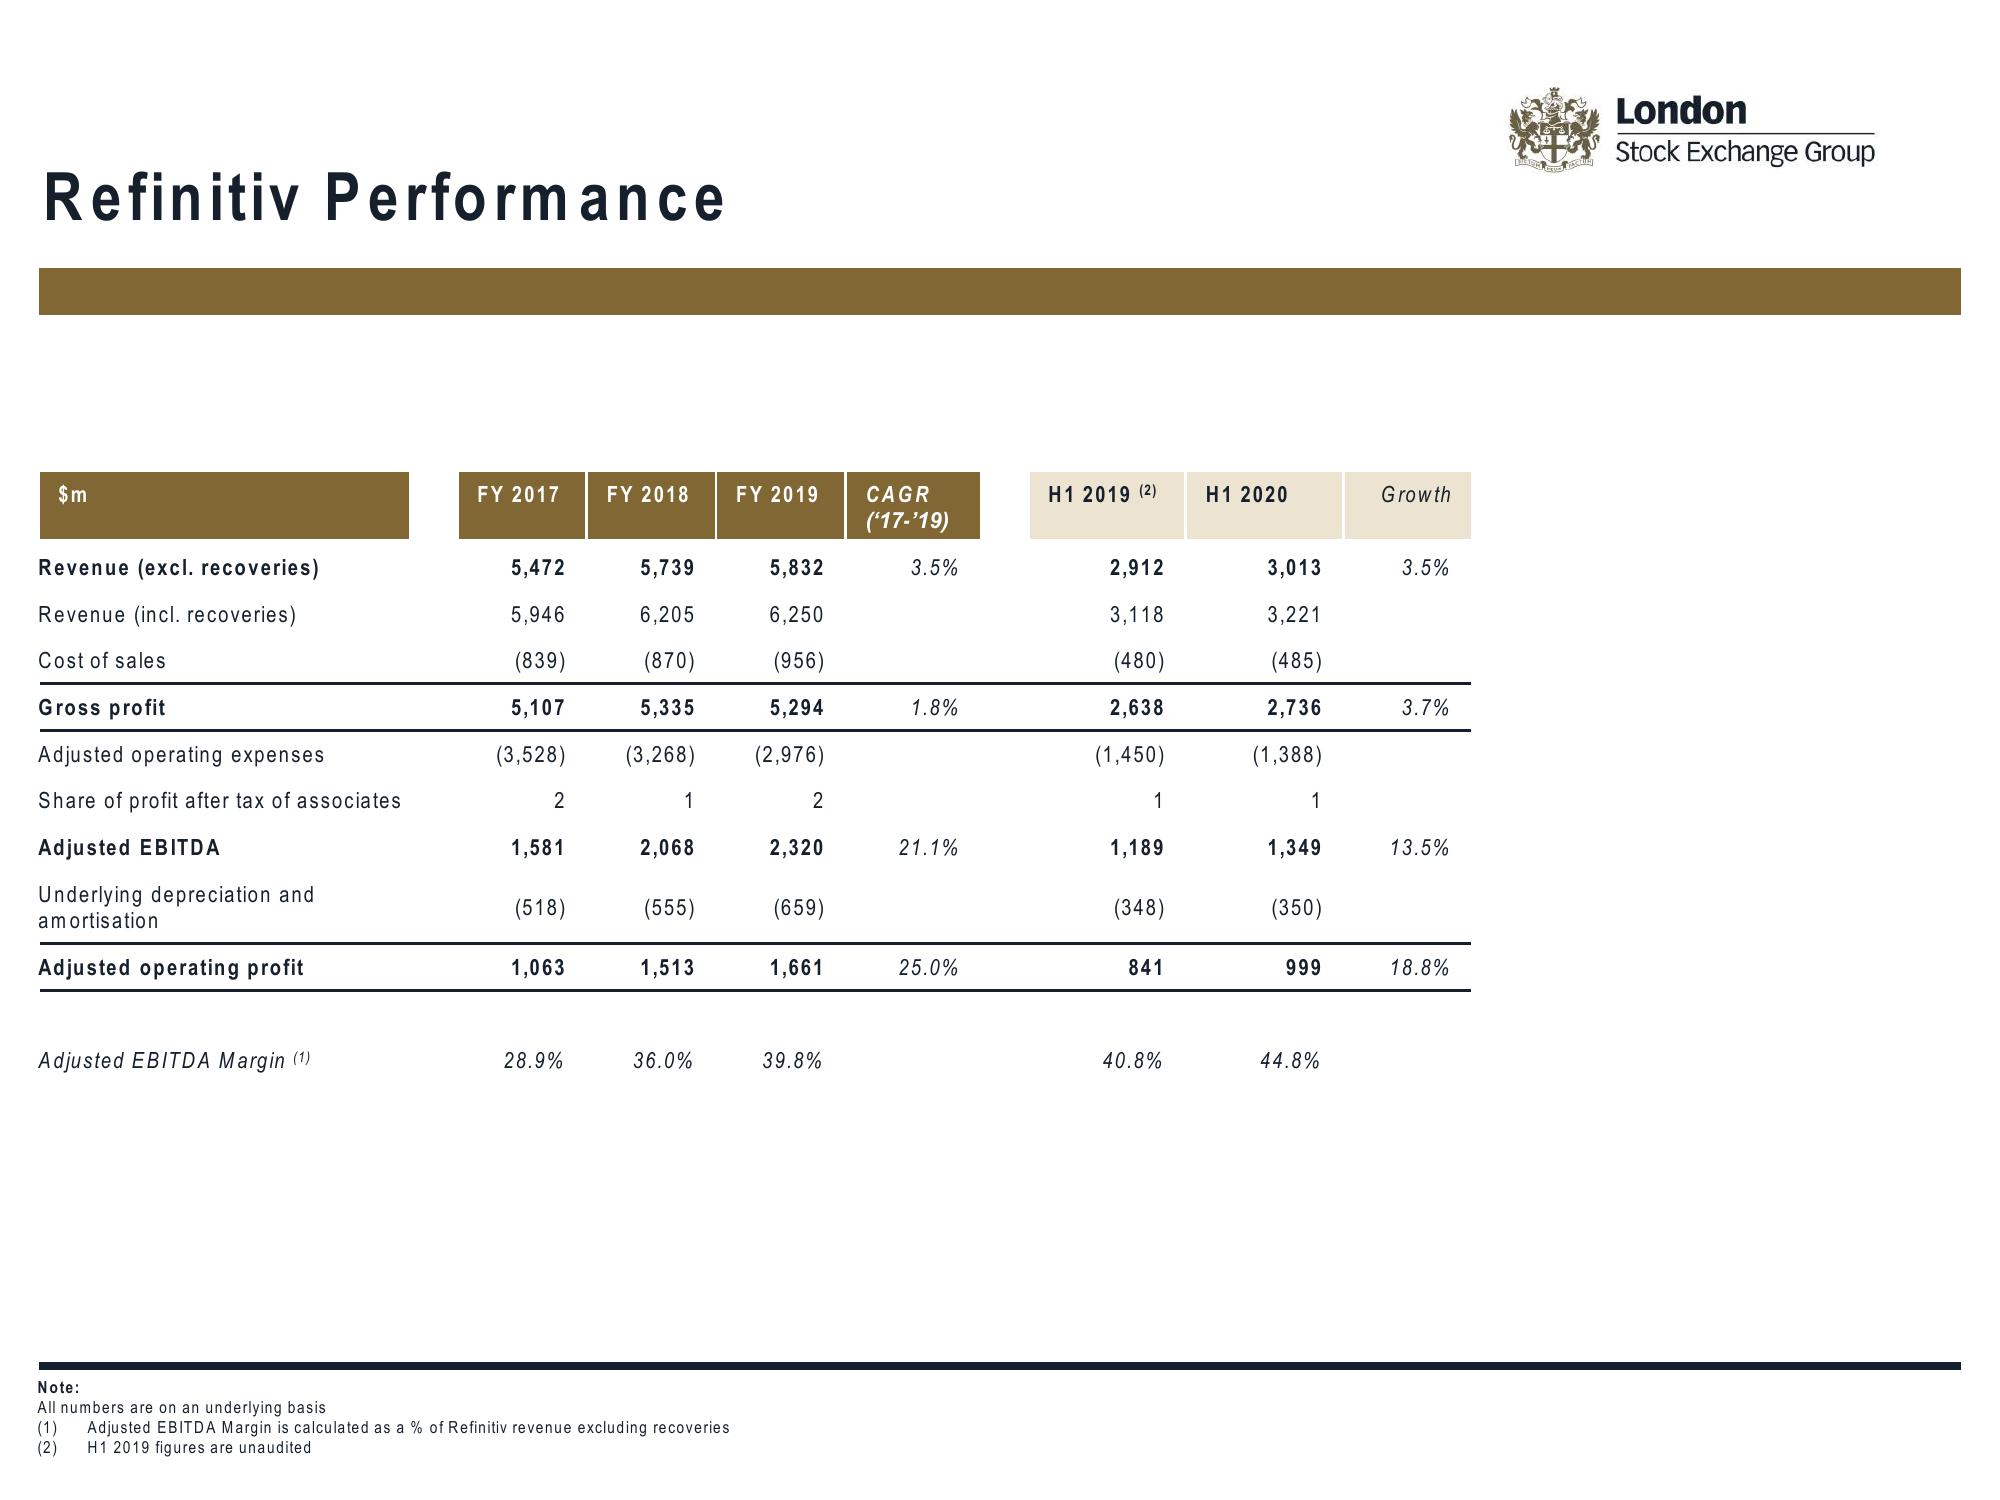
Refinitiv Performance
$m
Revenue (excl. recoveries)
Revenue (incl. recoveries)
Cost of sales
Gross profit
Adjusted operating expenses
Share of profit after tax of associates
Adjusted EBITDA
Underlying depreciation and
amortisation
Adjusted operating profit
Adjusted EBITDA Margin (1)
FY 2017
5,472
5,946
(839)
5,107
(3,528)
2
1,581
(518)
1,063
28.9%
FY 2018
5,739
5,832
6,205
6,250
(870)
(956)
5,335
5,294
(3,268) (2,976)
1
2,068
(555)
1,513
36.0%
FY 2019
Note:
All numbers are on an underlying basis
(1) Adjusted EBITDA Margin is calculated as a % of Refinitiv revenue excluding recoveries
(2) H1 2019 figures are unaudited
2
2,320
(659)
1,661
39.8%
CAGR
('17-'19)
3.5%
1.8%
21.1%
25.0%
H1 2019 (2)
2,912
3,118
(480)
2,638
(1,450)
1
1,189
(348)
841
40.8%
H1 2020
3,013
3,221
(485)
2,736
(1,388)
1
1,349
(350)
999
44.8%
Growth
3.5%
3.7%
13.5%
18.8%
London
Stock Exchange GroupView entire presentation