Pathward Financial Results Presentation Deck
COMMERCIAL FINANCE MIX¹
Total Exposure
●
●
●
MANUFACTURING
MANUFACTURING
Computer and Electronic Product Manufacturing
Fabricated Metal Product Manufacturing
Transportation Equipment Manufacturing
$446.0 million
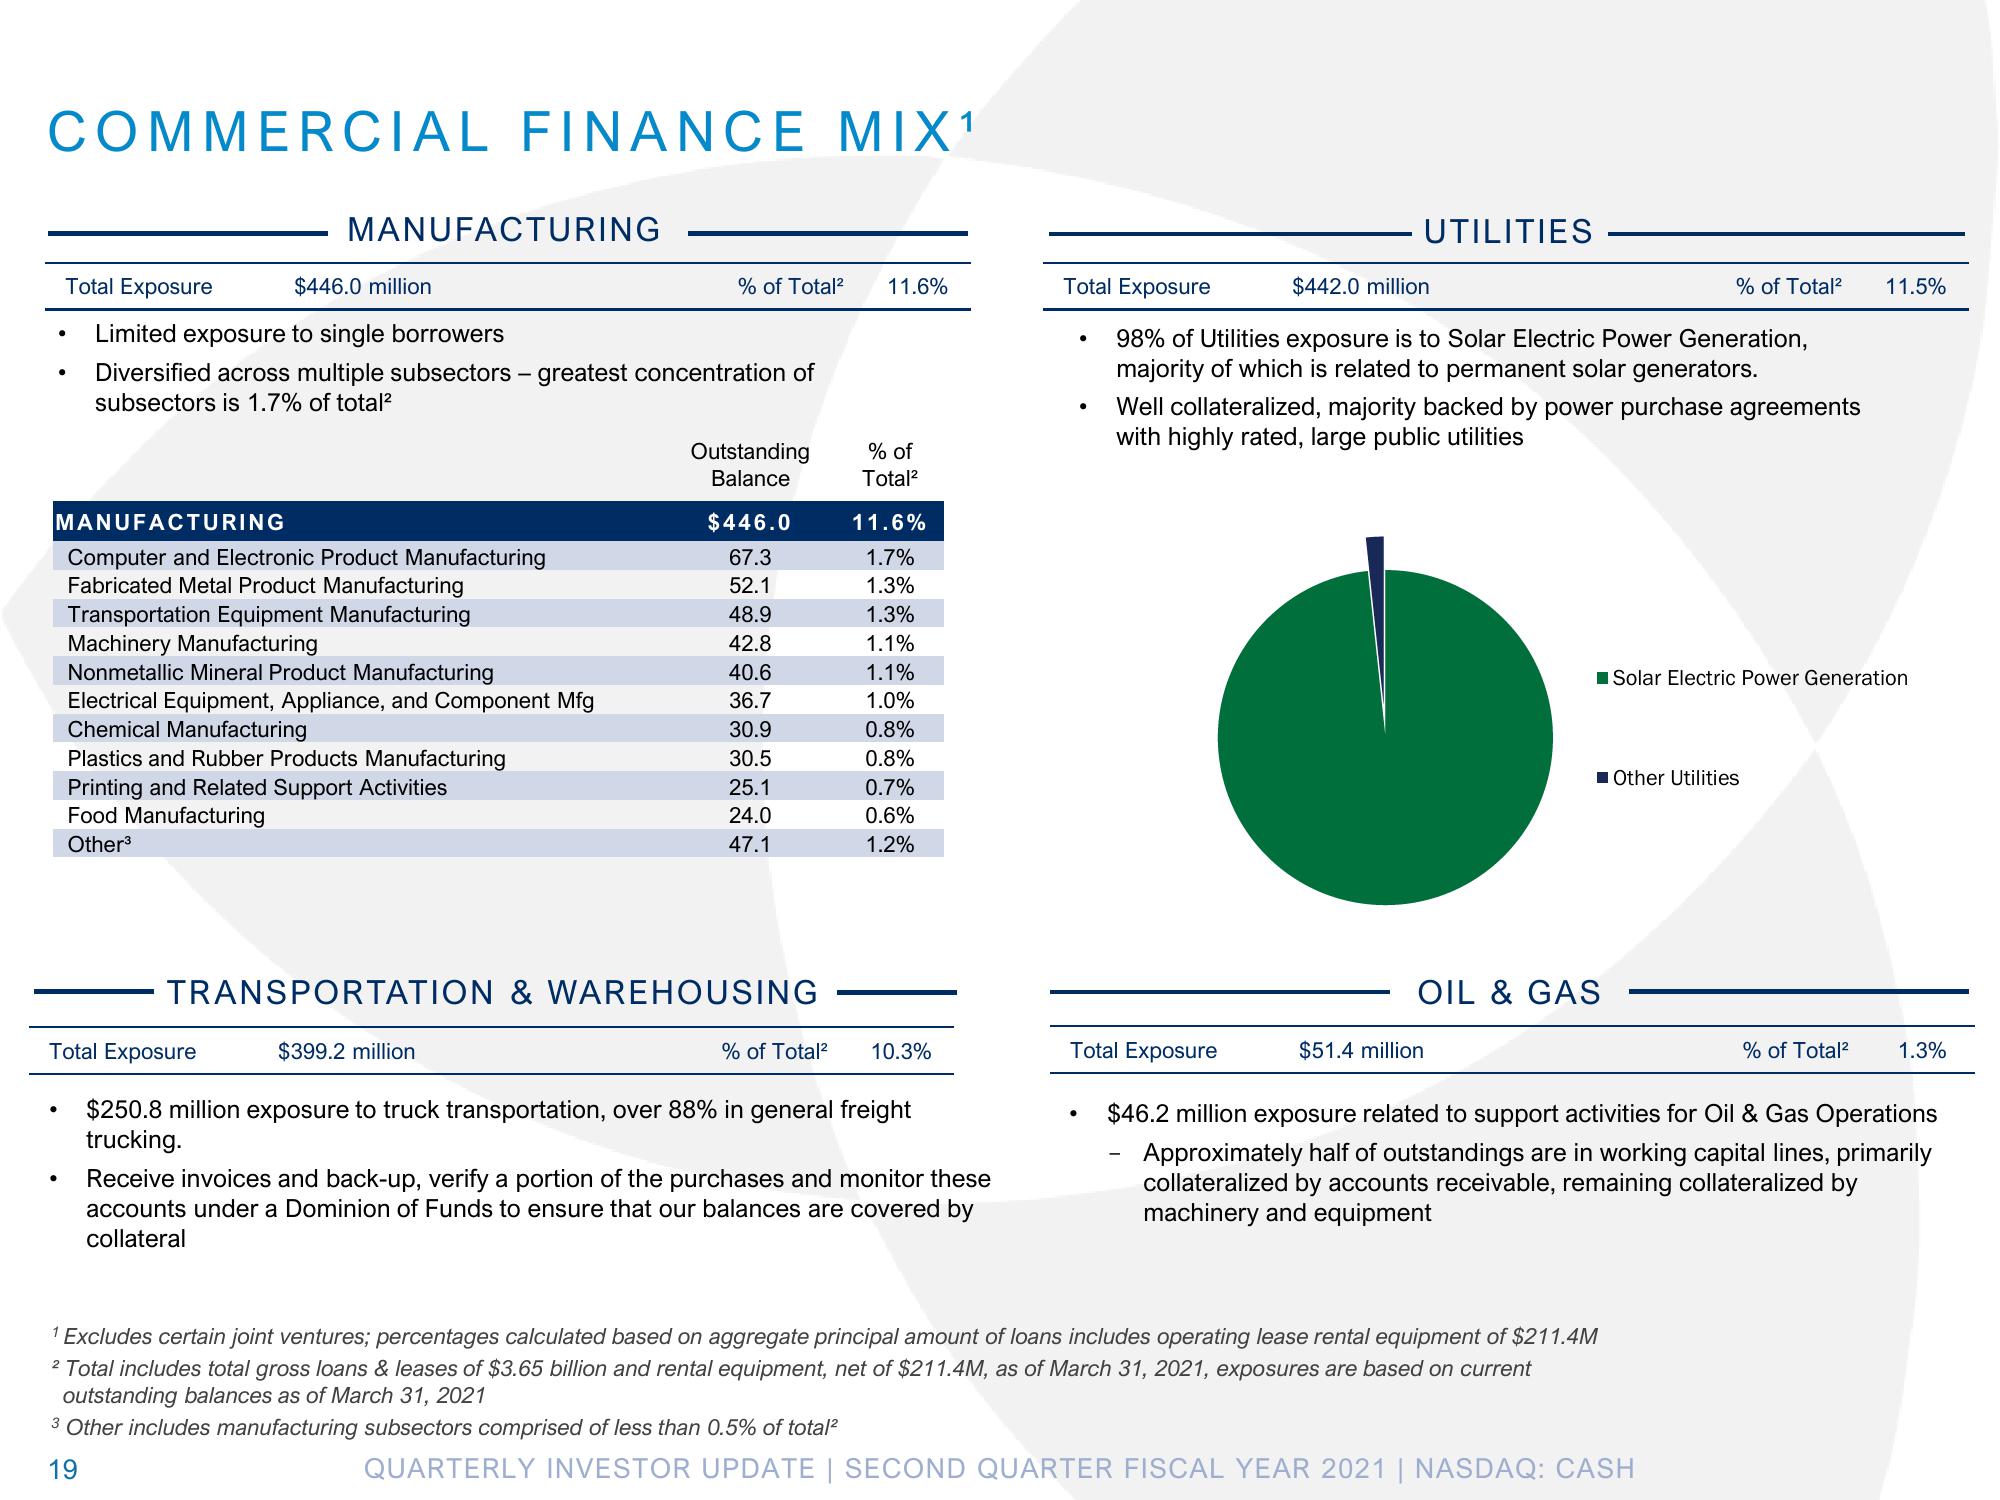
Limited exposure to single borrowers
Diversified across multiple subsectors - greatest concentration of
subsectors is 1.7% of total²
Total Exposure
Machinery Manufacturing
Nonmetallic Mineral Product Manufacturing
Electrical Equipment, Appliance, and Component Mfg
Chemical Manufacturing
Plastics and Rubber Products Manufacturing
Printing and Related Support Activities
Food Manufacturing
Other³
% of Total² 11.6%
$399.2 million
Outstanding
Balance
$446.0
67.3
52.1
48.9
42.8
40.6
36.7
30.9
TRANSPORTATION & WAREHOUSING
30.5
25.1
24.0
47.1
% of
Total²
11.6%
1.7%
1.3%
1.3%
1.1%
1.1%
1.0%
0.8%
0.8%
0.7%
0.6%
1.2%
% of Total² 10.3%
$250.8 million exposure to truck transportation, over 88% in general freight
trucking.
Receive invoices and back-up, verify a portion of the purchases and monitor these
accounts under a Dominion of Funds to ensure that our balances are covered by
collateral
Total Exposure
$442.0 million
98% of Utilities exposure is to Solar Electric Power Generation,
majority of which is related to permanent solar generators.
●
.
UTILITIES
Total Exposure
Well collateralized, majority backed by power purchase agreements
with highly rated, large public utilities
OIL & GAS
$51.4 million
% of Total²
Excludes certain joint ventures; percentages calculated based on aggregate principal amount of loans includes operating lease rental equipment of $211.4M
² Total includes total gross loans & leases of $3.65 billion and rental equipment, net of $211.4M, as of March 31, 2021, exposures are based on current
outstanding balances as of March 31, 2021
3 Other includes manufacturing subsectors comprised of less than 0.5% of total²
19
Solar Electric Power Generation
Other Utilities
QUARTERLY INVESTOR UPDATE | SECOND QUARTER FISCAL YEAR 2021 | NASDAQ: CASH
11.5%
% of Total²
$46.2 million exposure related to support activities for Oil & Gas Operations
Approximately half of outstandings are in working capital lines, primarily
collateralized by accounts receivable, remaining collateralized by
machinery and equipment
1.3%View entire presentation