Gorilla Technology Group SPAC Presentation Deck
.
-
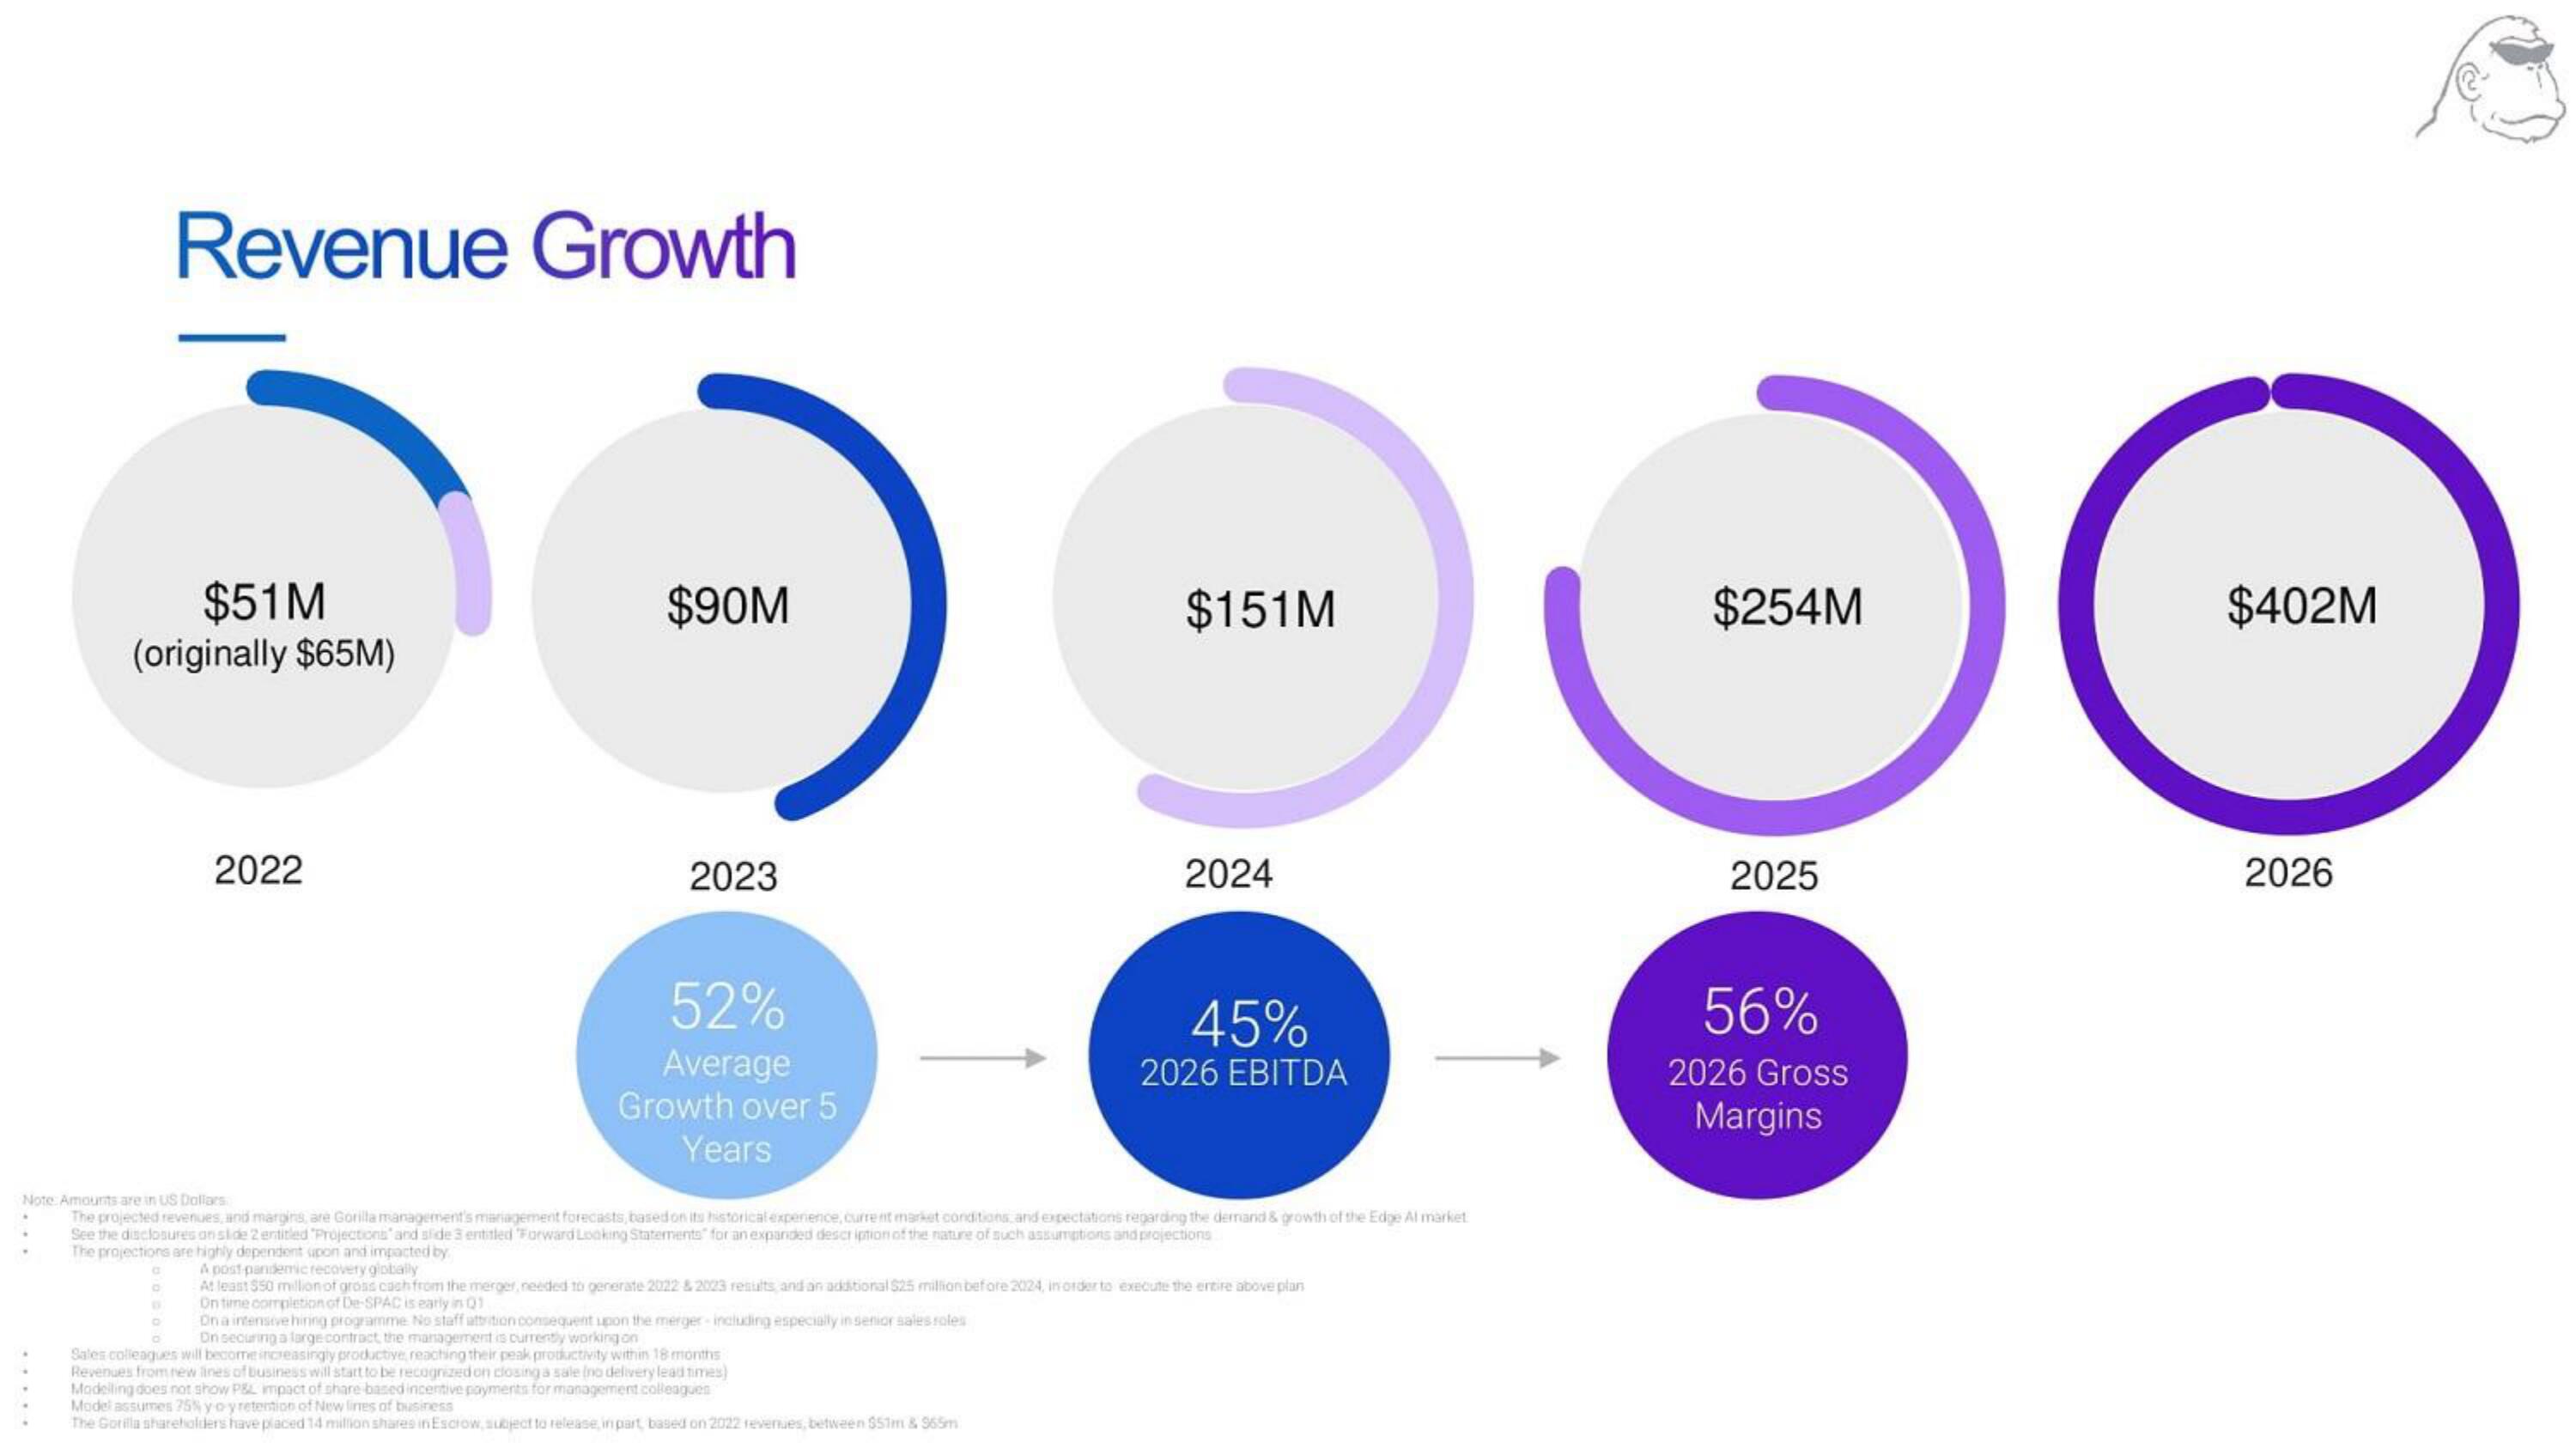
$51M
(originally $65M)
Revenue Growth
a
D
2022
$90M
2023
52%
Average
Growth over 5
Years
Note: Amounts are in US Dollars
The projected revenues, and marging, are Gorilla management's management forecasts, based on its historical experience, current market conditions, and expectations regarding the demand & growth of the Edge Al market
See the disclosures anside 2 entitled "Projections and side 3 entitled "Forward Looking Statements for an expanded description of the nature of such assumptions and projections
The projections are highly dependent upon and impacted by
$151M
Ona intensive hiring programme No staff attrition consequent upon the merger-including especially in senior sales soles
On securing a large contract, the management is currently working on
2024
Sales colleagues will become increasingly productive, reaching their peak productivity within 18 months
Revenues from new lines of business will start to be recognized on closing a sale ino delivery lead times)
Modelling does not show P&L impact of share based incentive payments for management colleagues
Model assumes 75% yo-yretention of New lines of business
The Gorilla shareholders have placed 14 million shares in Escrow, subject to release, in part, based on 2022 revenues, between $51m & 965m
45%
2026 EBITDA
A post pandemic recovery globally
At least $50 million of gross cash from the merger, needed to generate 2022 & 2023 results and an additional $25 million before 2024, in order to execute the entire above plan
On time completion of De-SPAC is early in 01
$254M
2025
56%
2026 Gross
Margins
$402M
2026View entire presentation