Yatsen IPO Presentation Deck
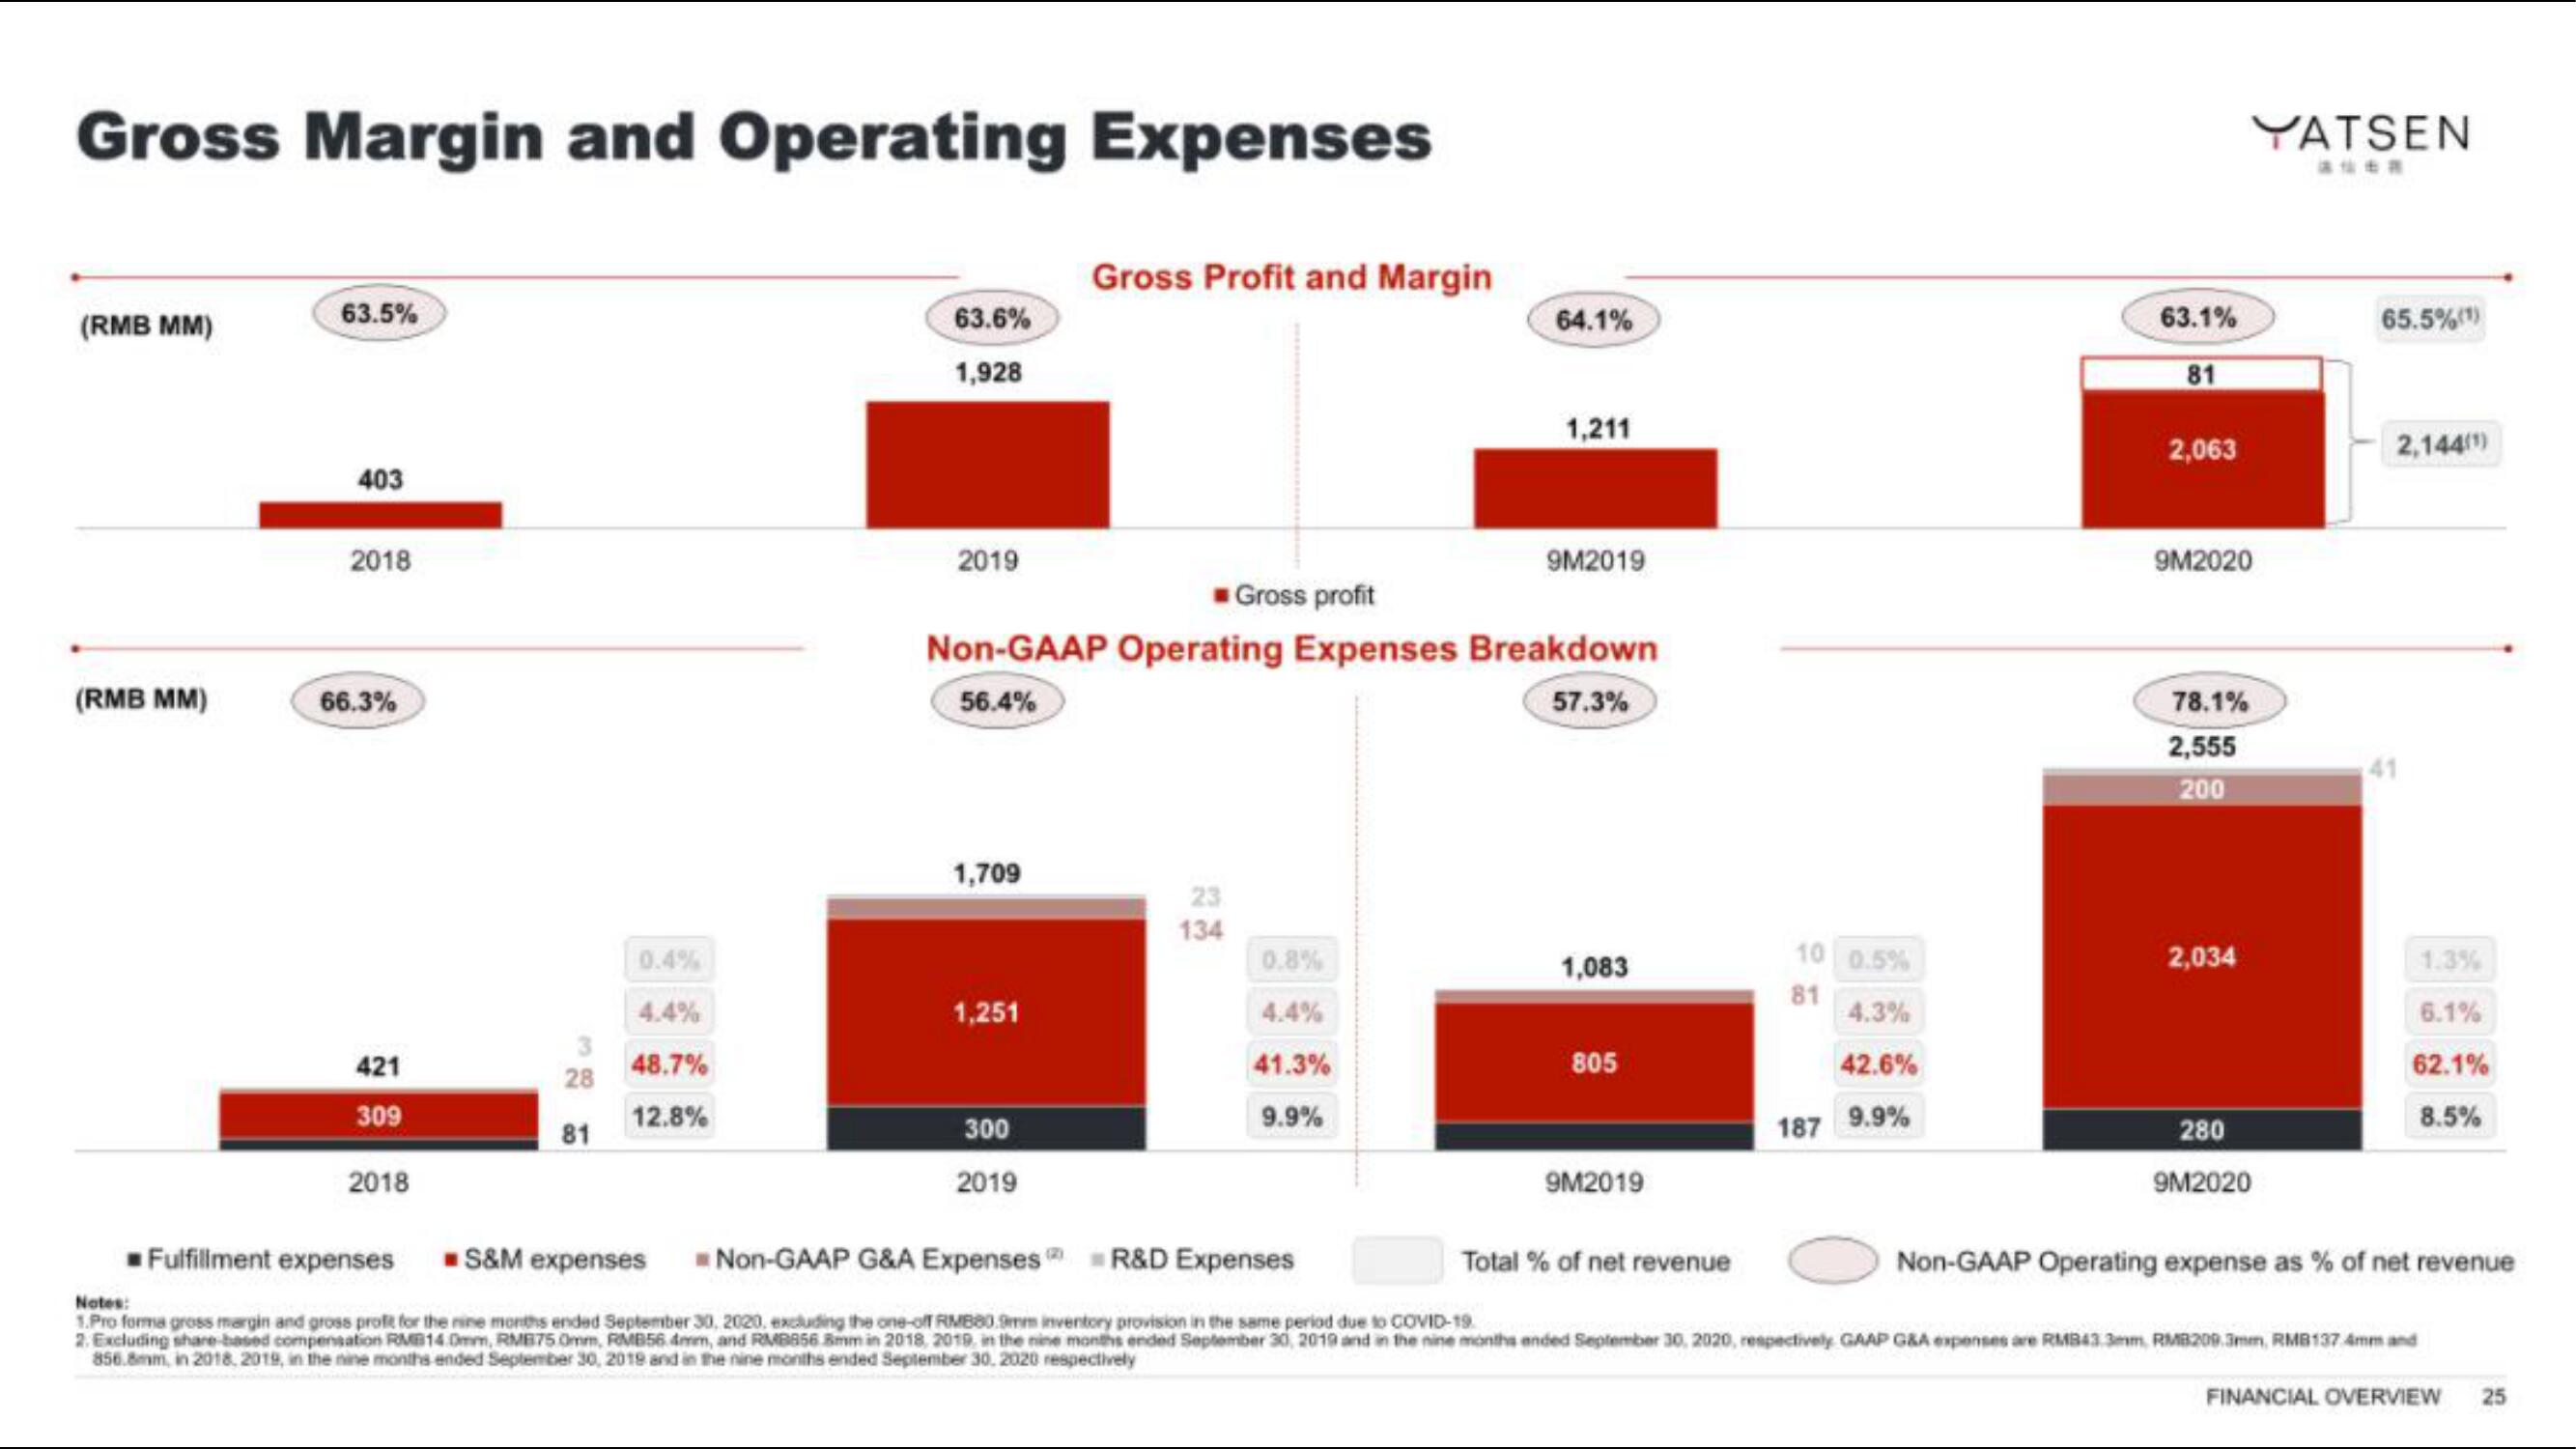
Gross Margin and Operating Expenses
(RMB MM)
(RMB MM)
63.5%
403
2018
66.3%
421
309
2018
3
28
81
0.4%
4.4%
48.7%
12.8%
63.6%
1,928
2019
1,709
1,251
Gross Profit and Margin
300
2019
Gross profit
Non-GAAP Operating Expenses Breakdown
56.4%
57.3%
23
134
64.1%
0.8%
4.4%
41.3%
9.9%
1,211
9M2019
1,083
805
9M2019
10 0.5%
81
4.3%
42.6%
187 9.9%
Total% of net revenue
63.1%
81
2,063
9M2020
78.1%
2,555
200
YATSEN
2,034
280
9M2020
65.5% (1)
2,144(¹)
1.3%
6.1%
62.1%
8.5%
Fulfillment expenses S&M expenses
#Non-GAAP G&A Expenses R&D Expenses
Non-GAAP Operating expense as % of net revenue
Notes:
1.Pro forma gross margin and gross profit for the nine months ended September 30, 2020, excluding the one-off RMB80.9mm inventory provision in the same period due to COVID-19.
2. Excluding share based compensation RM14.0mm, RMB75 0mm, RMB56 4mm, and RMB856 8mm in 2018, 2019, in the nine months ended September 30, 2019 and in the nine months ended September 30, 2020, respectively GAAP G&A expenses are RMB43.3mm, RMB209.3mm, RMB1374mm and
856.8mm, in 2018, 2019, in the nine months ended September 30, 2018 and in the nine months ended September 30, 2020 respectively
FINANCIAL OVERVIEW
25View entire presentation