Uber Results Presentation Deck
Continued:
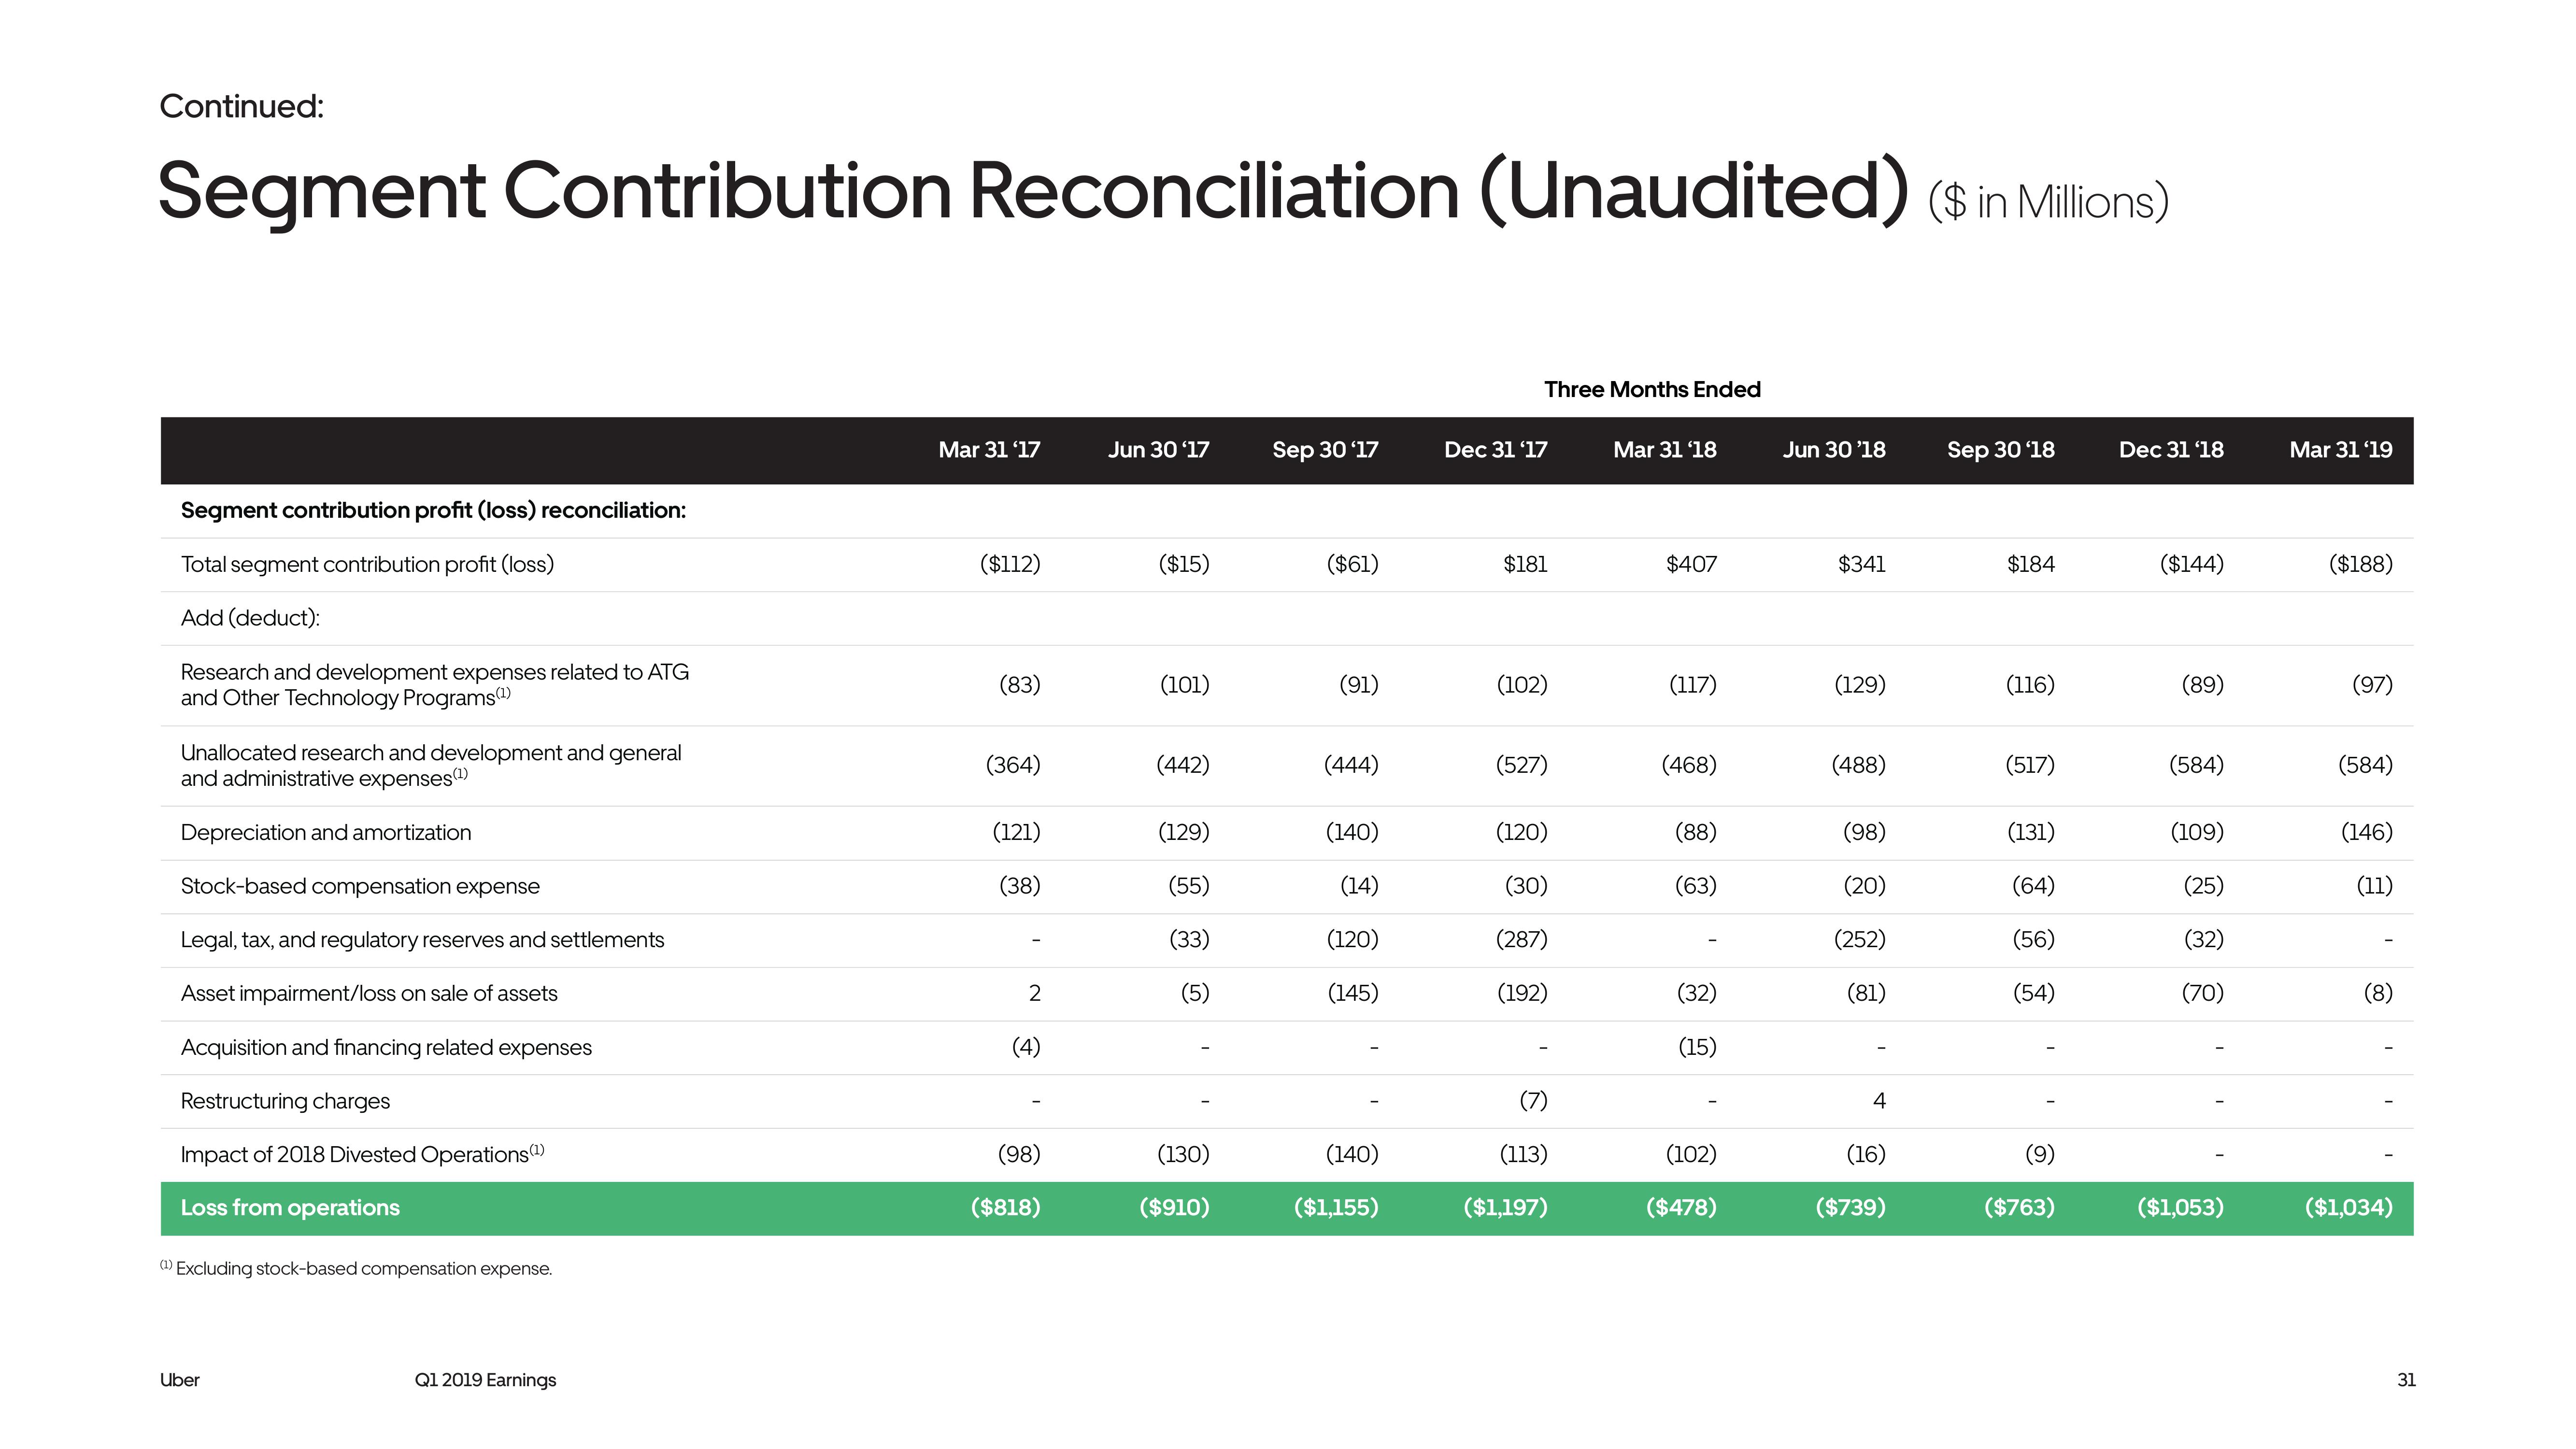
Segment Contribution Reconciliation (Unaudited) ($ in Millions)
Segment contribution profit (loss) reconciliation:
Total segment contribution profit (loss)
Add (deduct):
Research and development expenses related to ATG
and Other Technology Programs(¹)
Unallocated research and development and general
and administrative expenses (¹)
Depreciation and amortization
Stock-based compensation expense
Legal, tax, and regulatory reserves and settlements
Asset impairment/loss on sale of assets
Acquisition and financing related expenses
Restructuring charges
Impact of 2018 Divested Operations (¹)
Loss from operations
(1) Excluding stock-based compensation expense.
Uber
Q1 2019 Earnings
Mar 31 '17
($112)
(83)
(364)
(121)
(38)
2
(4)
(98)
($818)
Jun 30 '17
($15)
(101)
(442)
(129)
(55)
(33)
(5)
(130)
($910)
Sep 30 '17
($61)
(91)
(444)
(140)
(14)
(120)
(145)
(140)
($1,155)
Three Months Ended
Dec 31 '17
$181
(102)
(527)
(120)
(30)
(287)
(192)
I
(7)
(113)
($1,197)
Mar 31 '18
$407
(117)
(468)
(88)
(63)
(32)
(15)
(102)
($478)
Jun 30 '18
$341
(129)
(488)
(98)
(20)
(252)
(81)
4
(16)
($739)
Sep 30'18
$184
(116)
(517)
(131)
(64)
(56)
(54)
(9)
($763)
Dec 31 '18
($144)
(89)
(584)
(109)
(25)
(32)
(70)
($1,053)
Mar 31 '19
($188)
(97)
(584)
(146)
(11)
(8)
($1,034)
31View entire presentation