Enfusion Results Presentation Deck
*:enfusion
REVENUES:
Platform subscriptions
Managed services
Other
Total revenues
COST OF REVENUES:
Platform subscriptions
Managed services
Other
Total cost of revenues
Gross profit
OPERATING EXPENSES:
General and administrative
Sales and marketing
Technology and development
Total operating expenses
Income (loss) from operations
NON-OPERATING INCOME (EXPENSE):
Other income (expense)
Total non-operating income (expense)
Income (loss) before income taxes
Income taxes
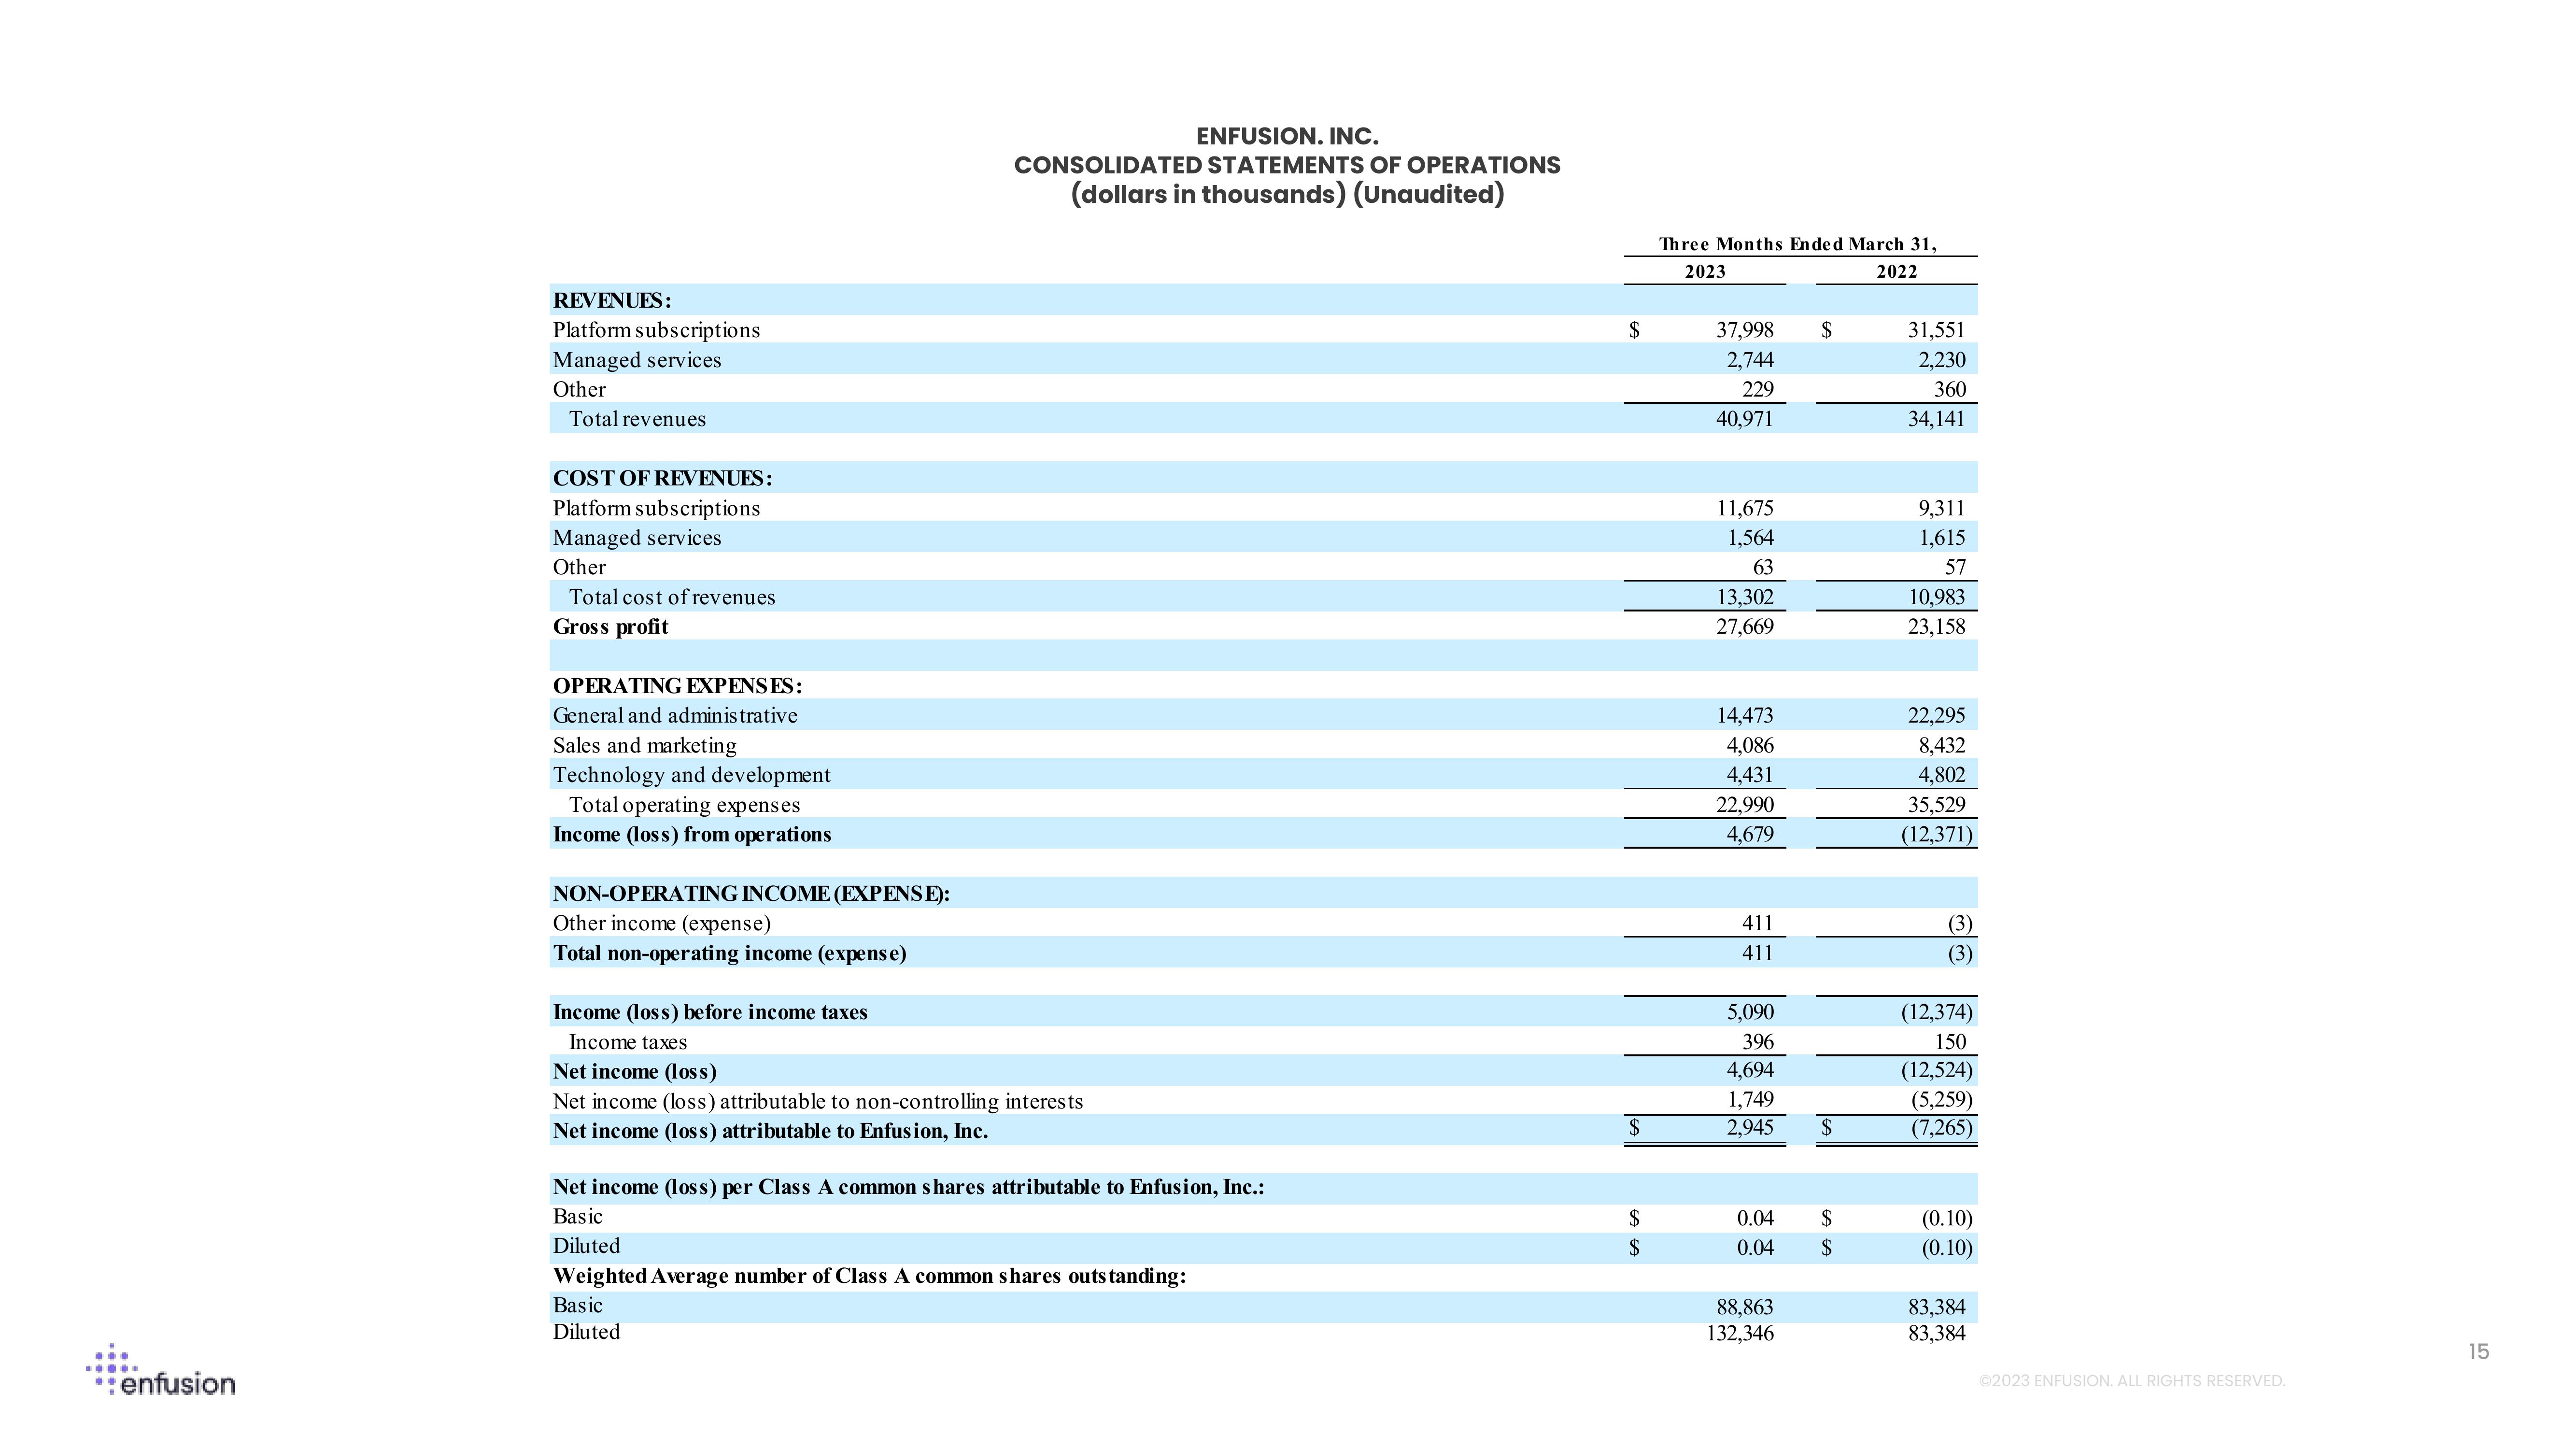
ENFUSION. INC.
CONSOLIDATED STATEMENTS OF OPERATIONS
(dollars in thousands) (Unaudited)
Net income (loss)
Net income (loss) attributable to non-controlling interests
Net income (loss) attributable to Enfusion, Inc.
Net income (loss) per Class A common shares attributable to Enfusion, Inc.:
Basic
Diluted
Weighted Average number of Class A common shares outstanding:
Basic
Diluted
$
S
$
S
Three Months Ended March 31,
2023
2022
37,998
2,744
229
40,971
11,675
1,564
63
13,302
27,669
14,473
4,086
4,431
22,990
4,679
411
411
5,090
396
4,694
1,749
2,945
0.04
0.04
88,863
132,346
$
$
$
$
31,551
2,230
360
34,141
9,311
1,615
57
10,983
23,158
22.295
8,432
4,802
35,529
(12,371)
(3)
(3)
(12,374)
150
(12,524)
(5,259)
(7,265)
(0.10)
(0.10)
83,384
83,384
Ⓒ2023 ENFUSION. ALL RIGHTS RESERVED.
15View entire presentation