Credit Suisse Results Presentation Deck
Investment Bank
Significant pre-tax loss amid persistently challenging capital markets conditions and
lower capital usage
Revenues
PCL/
Costs
Profitability
Balance
Sheet
15
in USD mn
Fixed income sales & trading
Equity sales & trading¹
Capital markets
Advisory and other fees
Other²
Adjusted net revenues
Adjusted provision for credit losses
Adjusted total operating expenses
Adjusted pre-tax income/ (loss)
Reported pre-tax income/(loss)
Adjusted RoRC+
Reported RoRC+
Adjusted cost/income ratio
Risk-weighted assets in USD bn
Leverage exposure in USD bn
3Q22
558
248
99
232
(1)
1,136
(6)
1,782
(640)
(691)
(15)%
(16)%
157%
84
324
2Q22
622
342
38
190
(42)
1,150
57
1,953
(860)
(1,165)
(19)%
(26)%
170%
86
349
3Q21
825
535
977
379
(4)
2,712
22
2,028
662
911
13%
18%
75%
94
407
A 3Q21
(32)%
(54)%
(90)%
(39)%
n/m
(58)%
(12)%
n/m
n/m
(10)%
(20)%
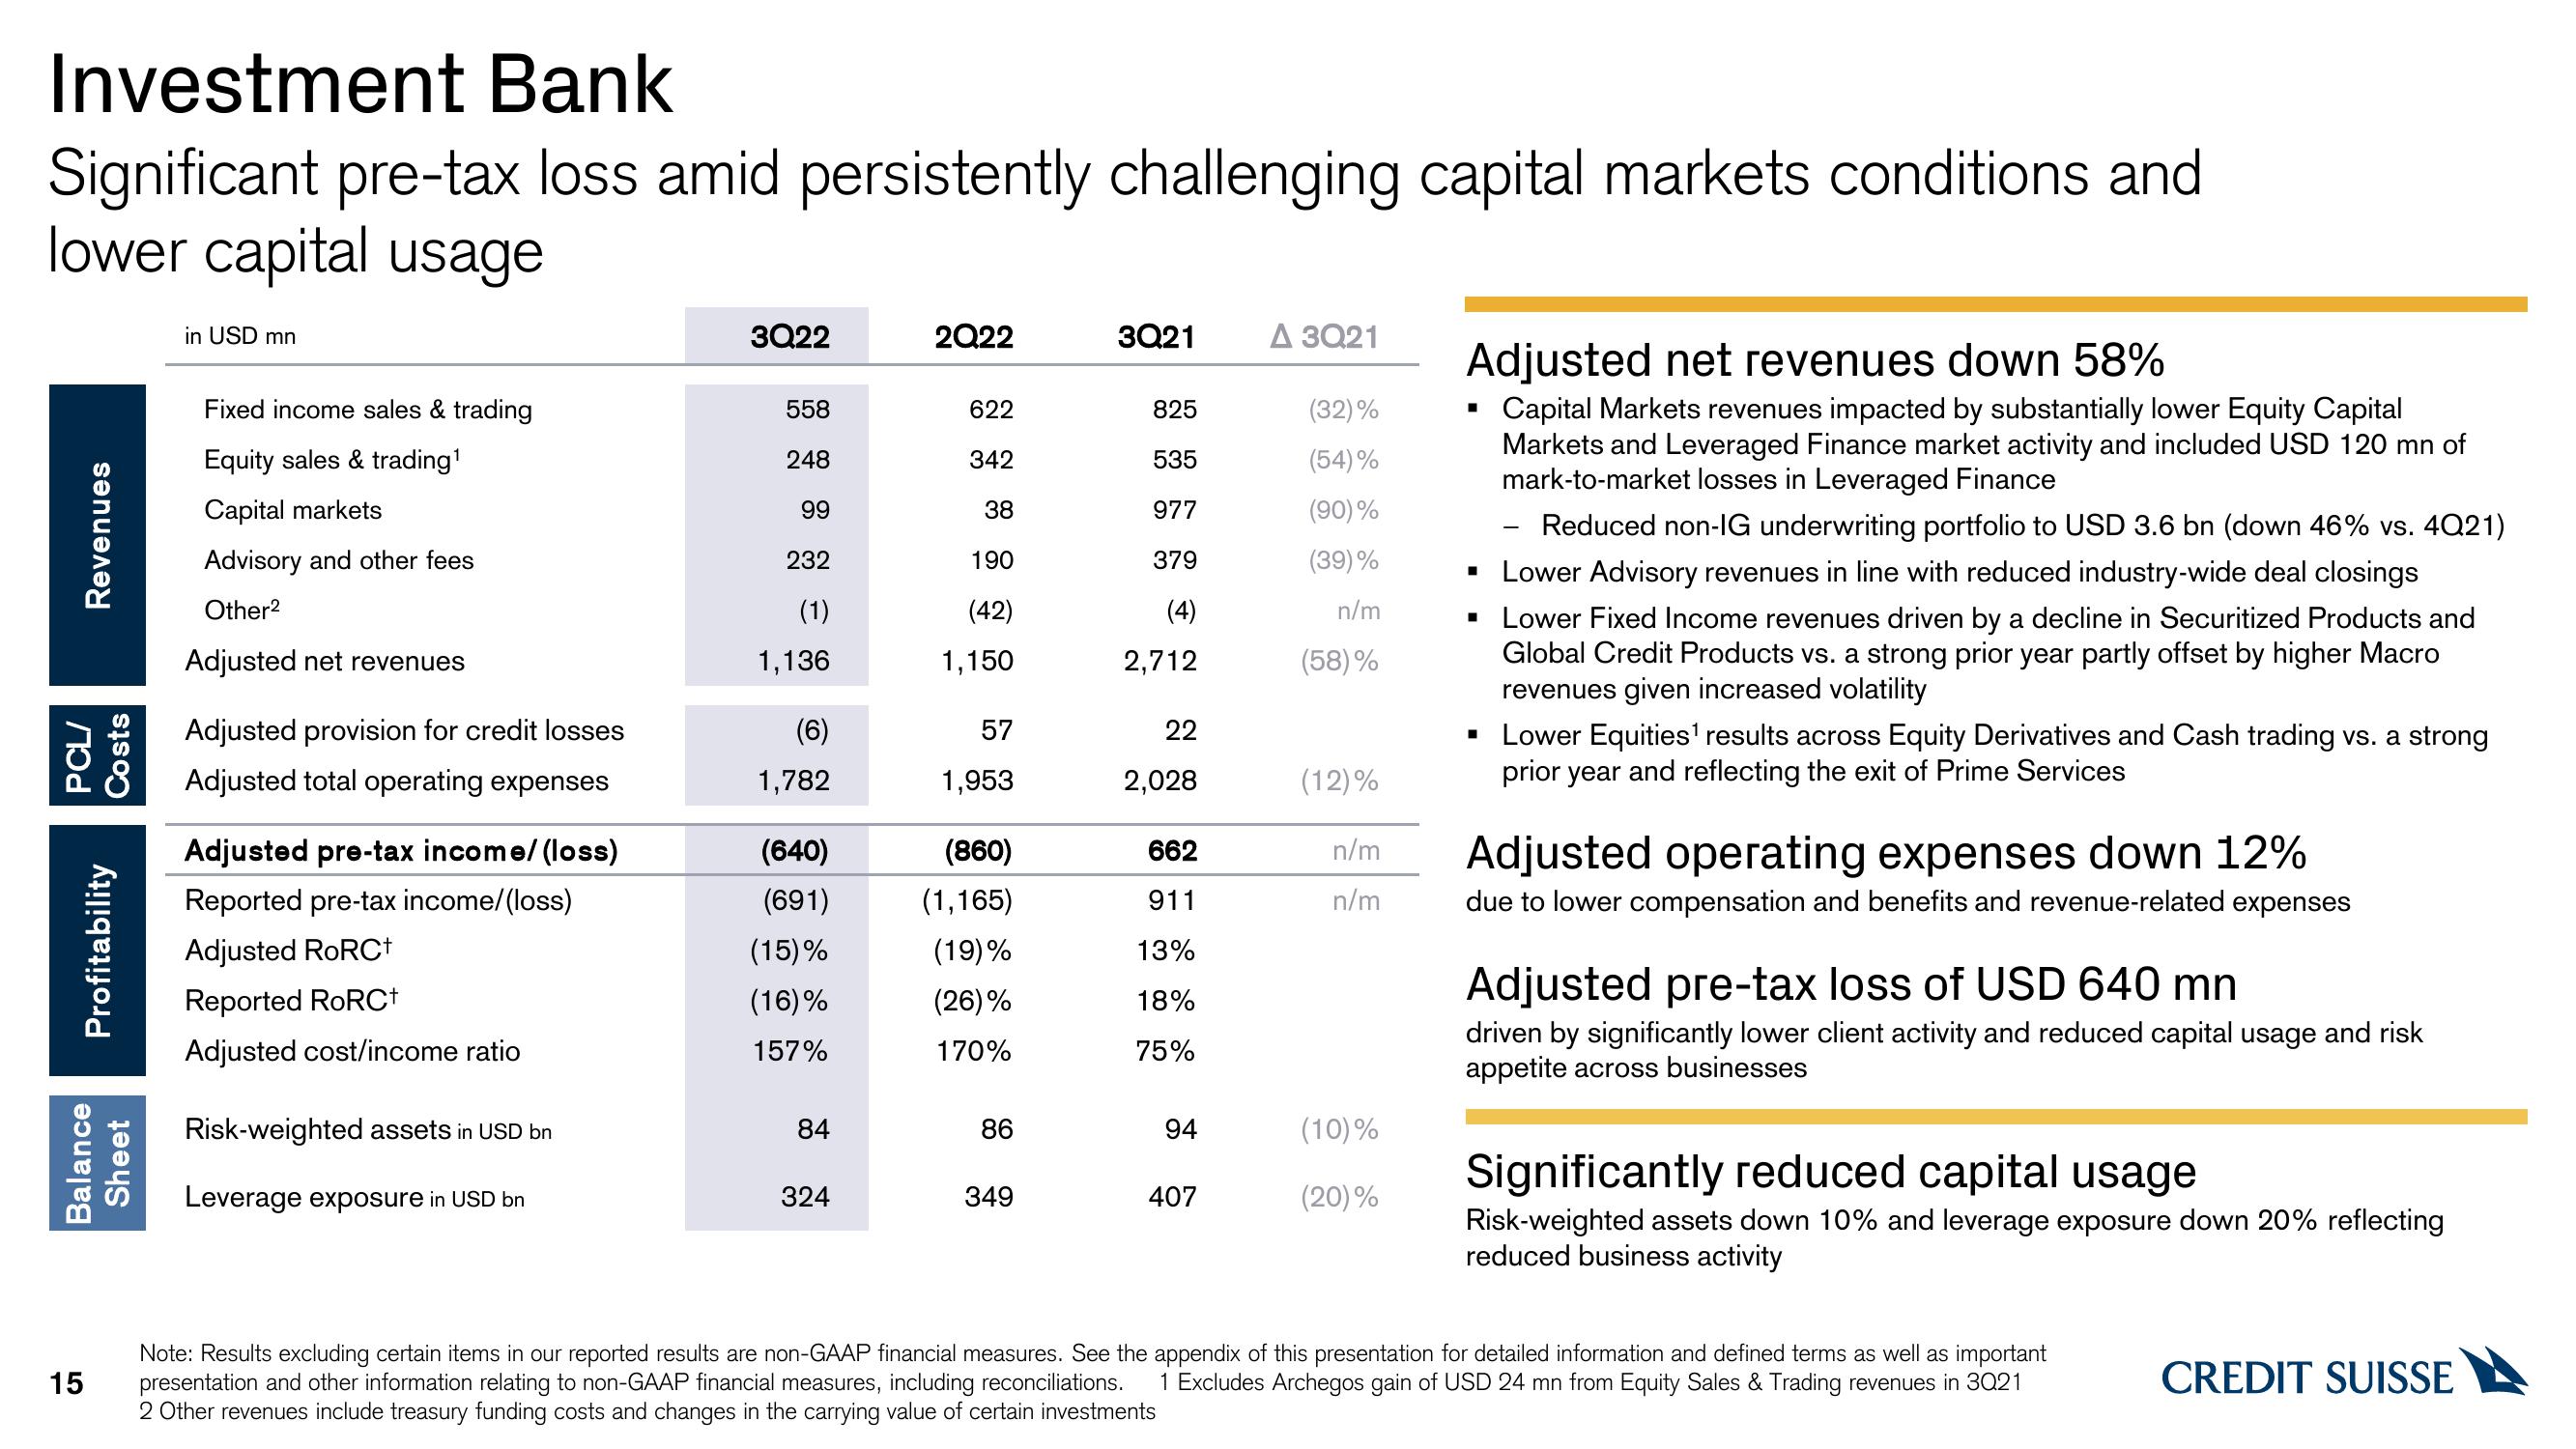
Adjusted net revenues down 58%
Capital Markets revenues impacted by substantially lower Equity Capital
Markets and Leveraged Finance market activity and included USD 120 mn of
mark-to-market losses in Leveraged Finance
Reduced non-IG underwriting portfolio to USD 3.6 bn (down 46% vs. 4Q21)
▪ Lower Advisory revenues in line with reduced industry-wide deal closings
Lower Fixed Income revenues driven by a decline in Securitized Products and
Global Credit Products vs. a strong prior year partly offset by higher Macro
revenues given increased volatility
■
▪ Lower Equities¹ results across Equity Derivatives and Cash trading vs. a strong
prior year and reflecting the exit of Prime Services
Adjusted operating expenses down 12%
due to lower compensation and benefits and revenue-related expenses
Adjusted pre-tax loss of USD 640 mn
driven by significantly lower client activity and reduced capital usage and risk
appetite across businesses
Significantly reduced capital usage
Risk-weighted assets down 10% and leverage exposure down 20% reflecting
reduced business activity
Note: Results excluding certain items in our reported results are non-GAAP financial measures. See the appendix of this presentation for detailed information and defined terms as well as important
presentation and other information relating to non-GAAP financial measures, including reconciliations. 1 Excludes Archegos gain of USD 24 mn from Equity Sales & Trading revenues in 3021
2 Other revenues include treasury funding costs and changes in the carrying value of certain investments
CREDIT SUISSEView entire presentation