Blend Investor Day Presentation Deck
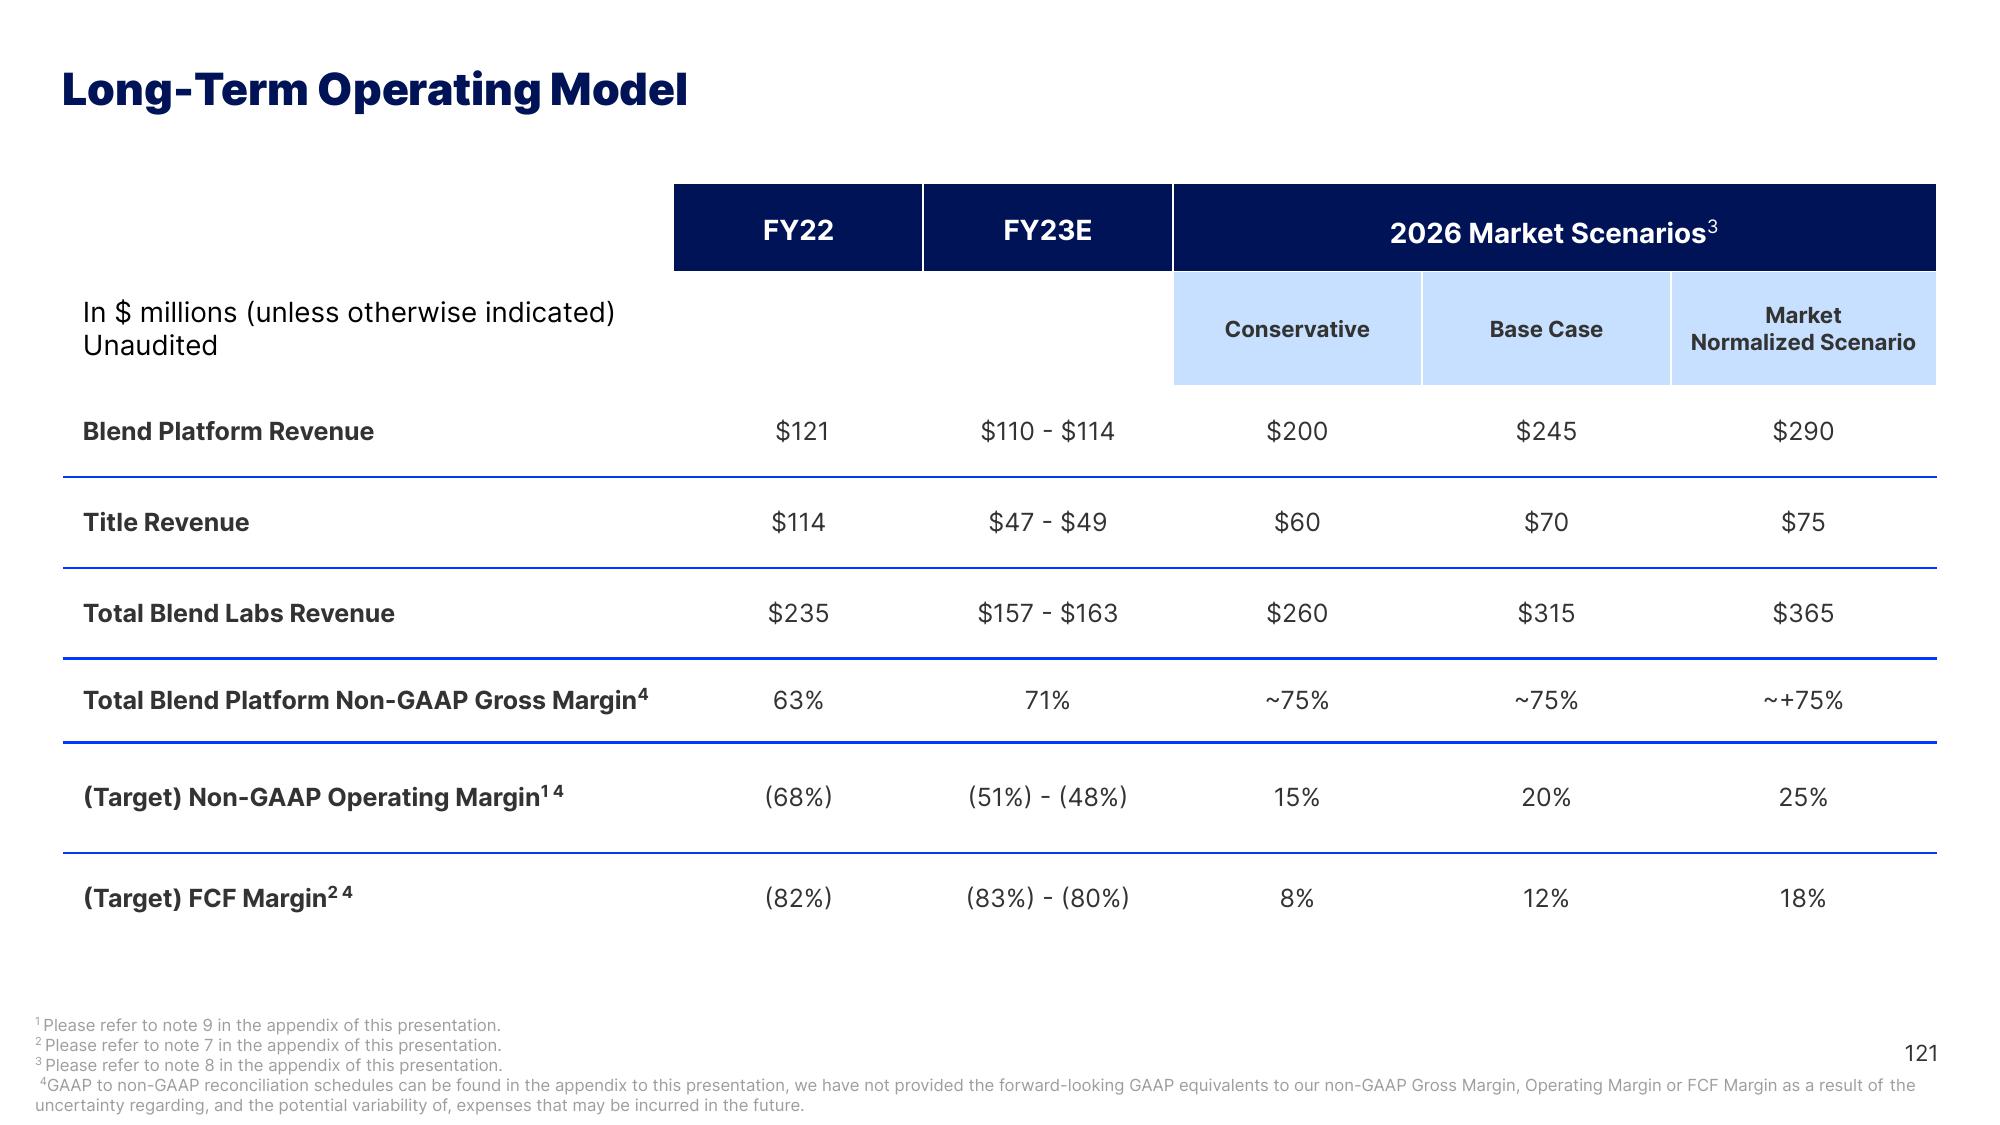
Long-Term Operating Model
In $ millions (unless otherwise indicated)
Unaudited
Blend Platform Revenue
Title Revenue
Total Blend Labs Revenue
Total Blend Platform Non-GAAP Gross Margin4
(Target) Non-GAAP Operating Margin¹4
(Target) FCF Margin24
FY22
$121
$114
$235
63%
(68%)
(82%)
FY23E
$110 - $114
$47 $49
$157 - $163
71%
(51%) - (48%)
(83%) - (80%)
Conservative
$200
$60
$260
~75%
15%
8%
2026 Market Scenarios³
Base Case
$245
$70
$315
~75%
20%
12%
Market
Normalized Scenario
$290
$75
$365
~+75%
25%
18%
¹Please refer to note 9 in the appendix of this presentation.
2 Please refer to note 7 in the appendix of this presentation.
121
3 Please refer to note 8 in the appendix of this presentation.
4GAAP to non-GAAP reconciliation schedules can be found in the appendix to this presentation, we have not provided the forward-looking GAAP equivalents to our non-GAAP Gross Margin, Operating Margin or FCF Margin as a result of the
uncertainty regarding, and the potential variability of, expenses that may be incurred in the future.View entire presentation