UBS Results Presentation Deck
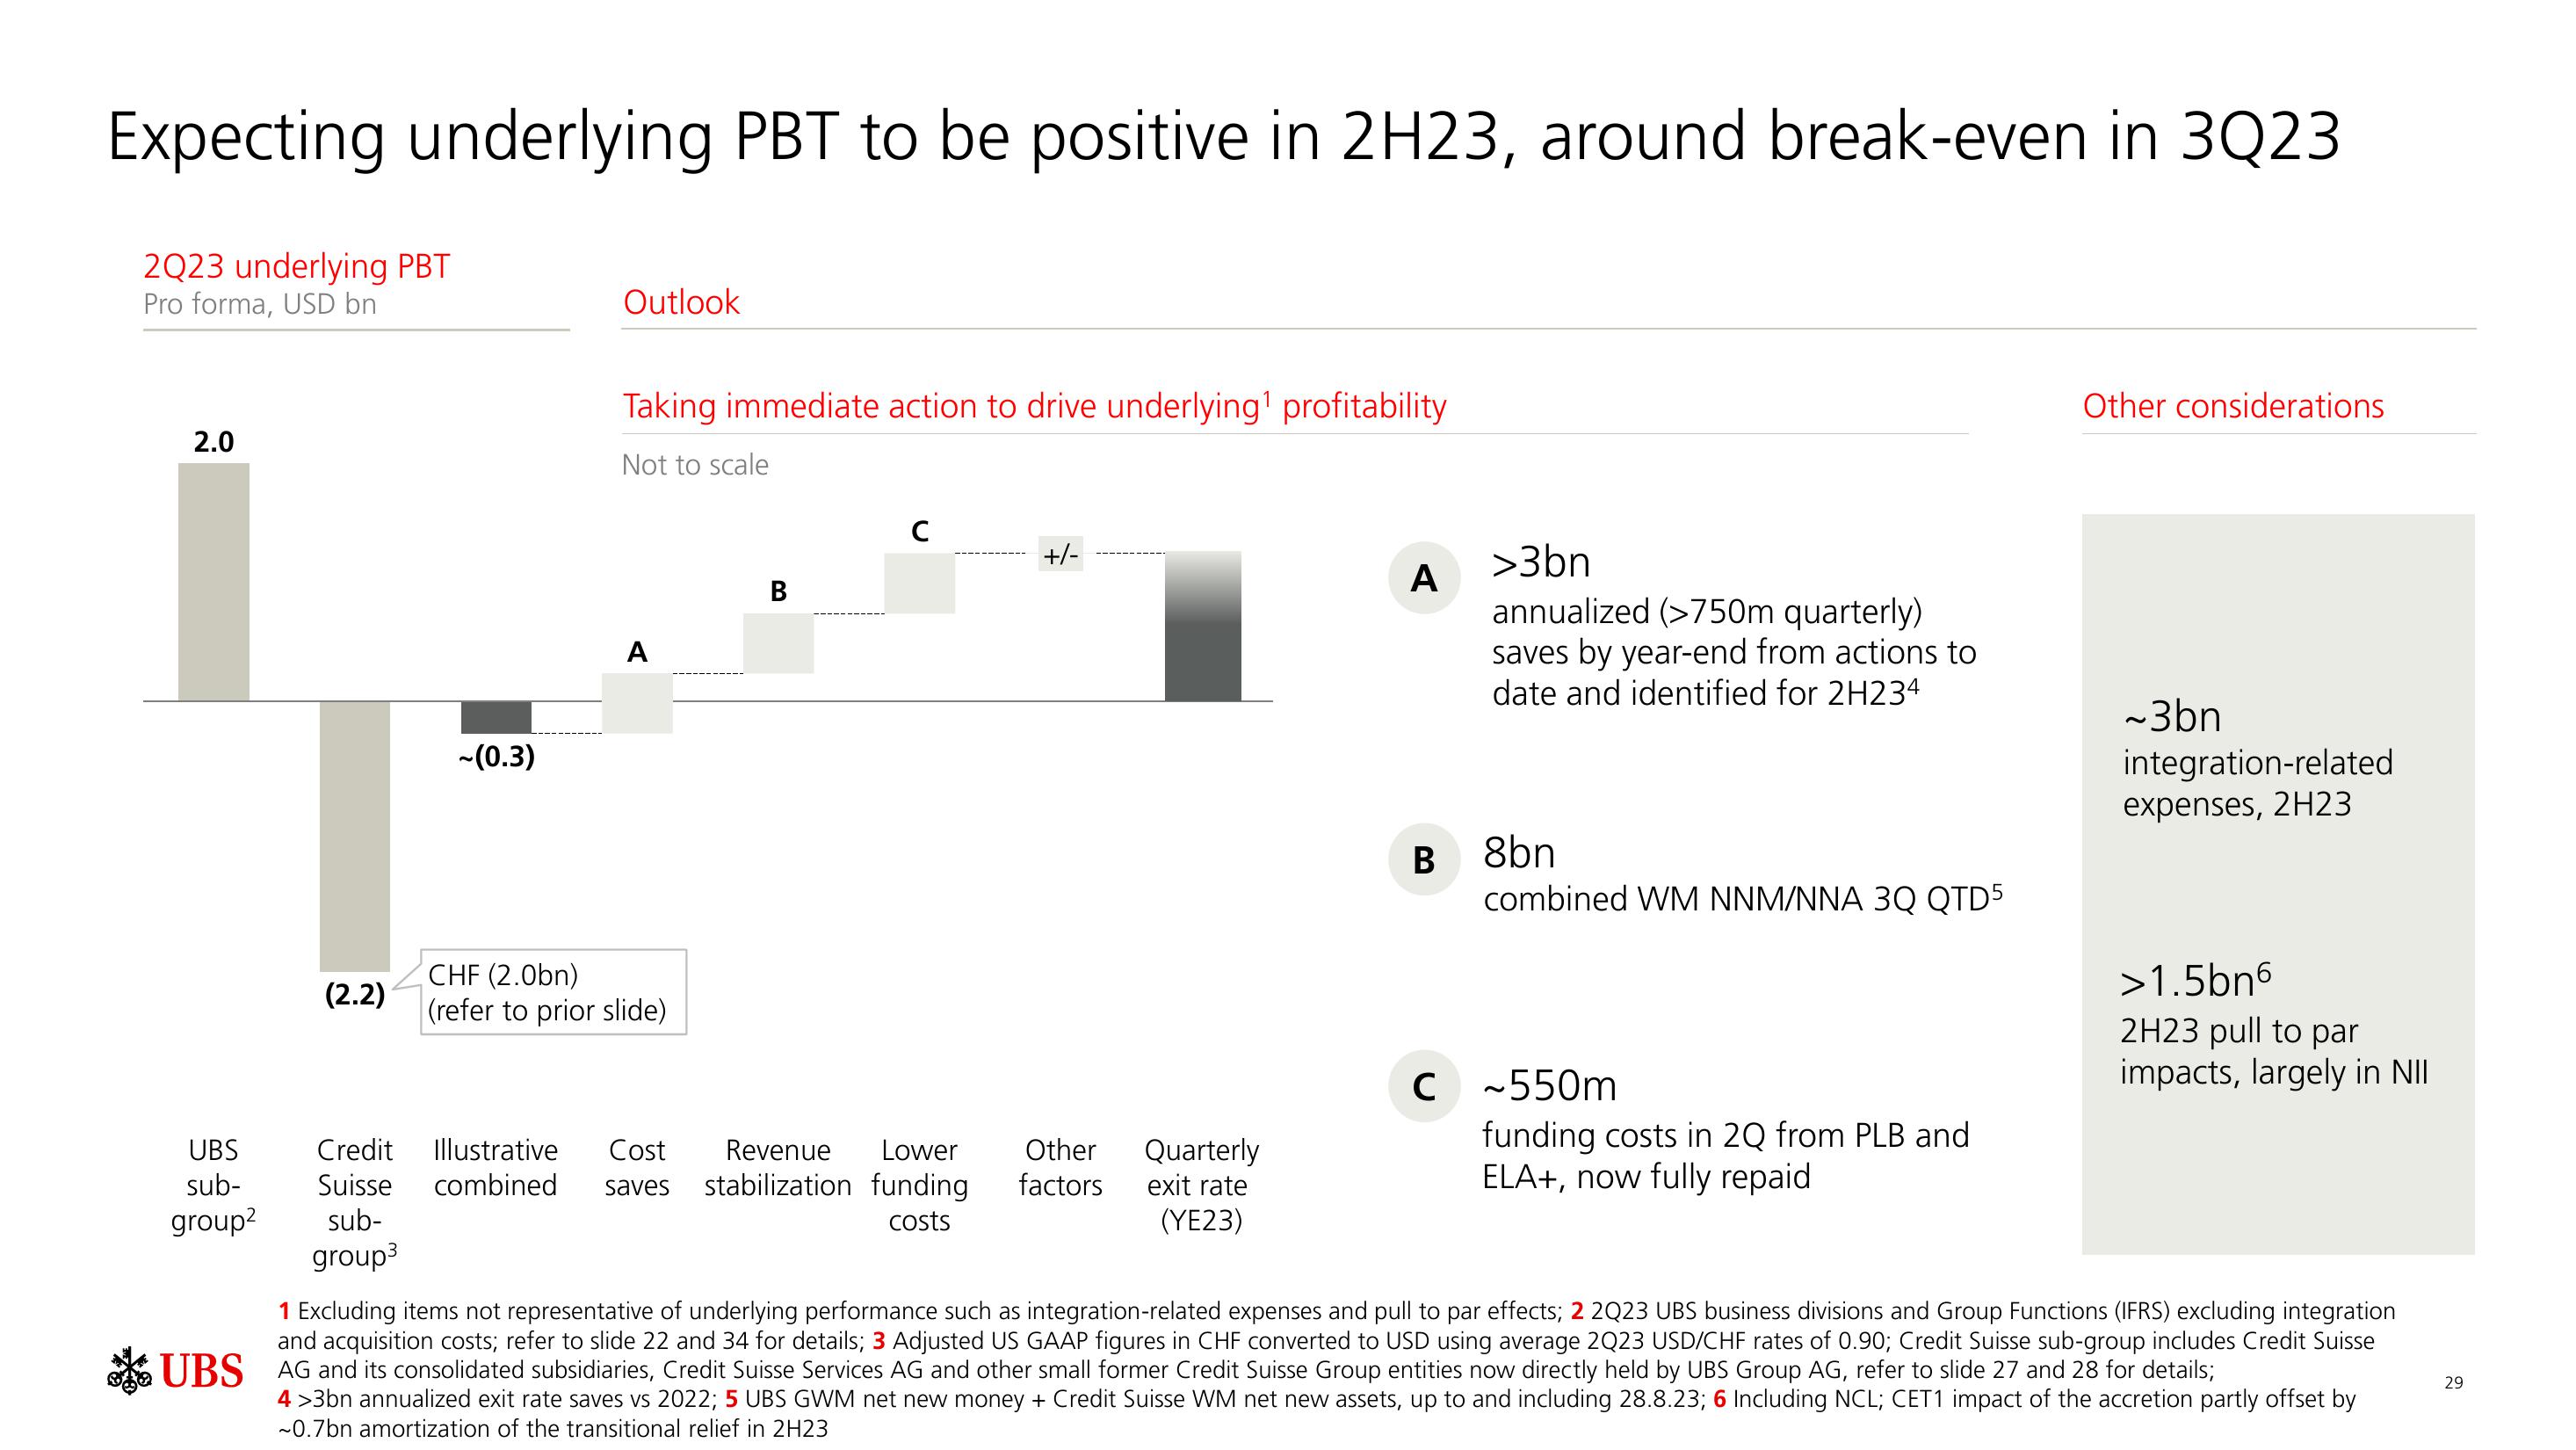
Expecting underlying PBT to be positive in 2H23, around break-even in 3Q23
2Q23 underlying PBT
Pro forma, USD bn
2.0
UBS
sub-
group²
(2.2)
~(0.3)
Outlook
Taking immediate action to drive underlying¹ profitability
Not to scale
A
CHF (2.0bn)
(refer to prior slide)
Credit Illustrative Cost
Suisse combined saves
sub-
group³
B
C
Revenue Lower
stabilization funding
costs
+/-
Other
factors
Quarterly
exit rate
(YE23)
A
B
C
с
>3bn
annualized (>750m quarterly)
saves by year-end from actions to
date and identified for 2H234
8bn
combined WM NNM/NNA 3Q QTD5
~550m
funding costs in 2Q from PLB and
ELA+, now fully repaid.
Other considerations
~3bn
integration-related
expenses, 2H23
>1.5bn6
2H23 pull to par
impacts, largely in NII
1 Excluding items not representative of underlying performance such as integration-related expenses and pull to par effects; 2 2Q23 UBS business divisions and Group Functions (IFRS) excluding integration
and acquisition costs; refer to slide 22 and 34 for details; 3 Adjusted US GAAP figures in CHF converted to USD using average 2Q23 USD/CHF rates of 0.90; Credit Suisse sub-group includes Credit Suisse
UBS AG and its consolidated subsidiaries, Credit Suisse Services AG and other small former Credit Suisse Group entities now directly held by UBS Group AG, refer to slide 27 and 28 for details;
4 >3bn annualized exit rate saves vs 2022; 5 UBS GWM net new money + Credit Suisse WM net new assets, up to and including 28.8.23; 6 Including NCL; CET1 impact of the accretion partly offset by
~0.7bn amortization of the transitional relief in 2H23
29View entire presentation