Morgan Stanley Investment Banking Pitch Book
Project Roosevelt
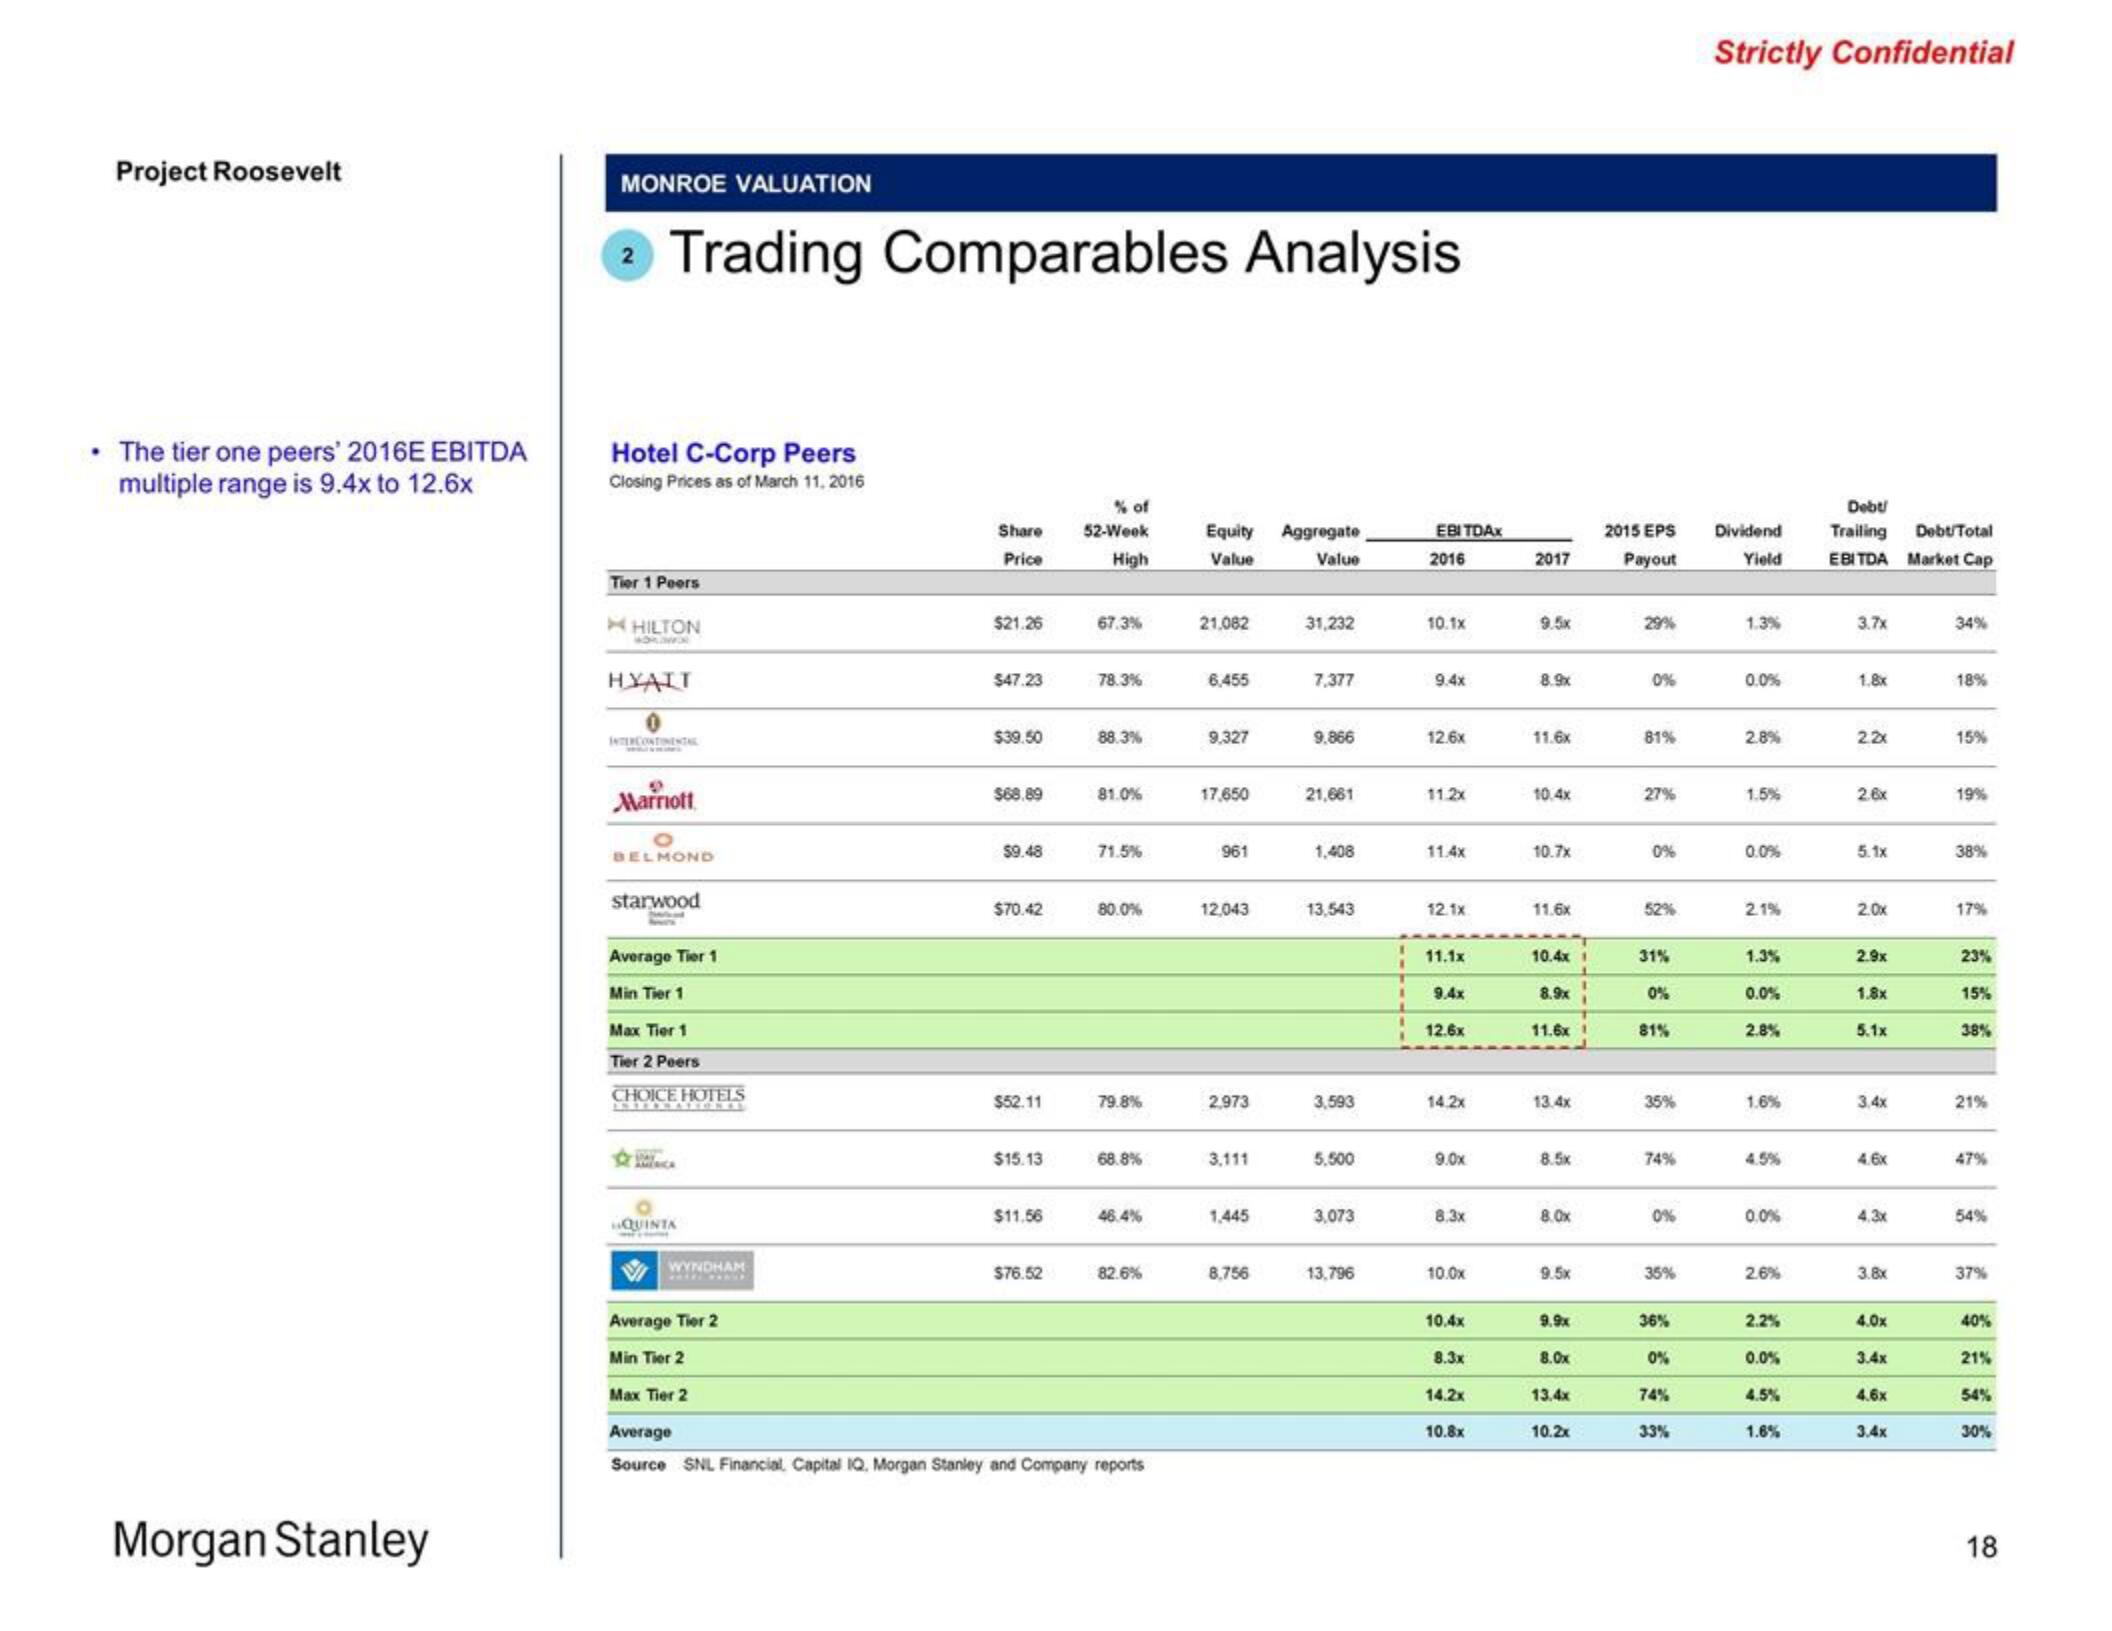
• The tier one peers' 2016E EBITDA
multiple range is 9.4x to 12.6x
Morgan Stanley
MONROE VALUATION
Trading Comparables Analysis
Hotel C-Corp Peers
Closing Prices as of March 11, 2016
Tier 1 Peers
HILTON
HYAIT
INTERCONTINENTAL
9
Marriott
O
BELMOND
starwood
Doorked
Average Tier 1
Min Tier 1
Max Tier 1
Tier 2 Peers
CHOICE HOTELS
ANTOORARIONES
DAY
QUINTA
WYNDHAM
Average Tier 2
Min Tier 2
Max Tier 2
Share
Price
$21.26
$47.23
$39.50
$68.89
$9.48
$70.42
$52.11
$15.13
$11.56
$76.52
% of
52-Week
High
67.3%
78.3%
88.3%
81.0%
71.5%
80.0%
79.8%
68.8%
46.4%
82.6%
Average
Source SNL Financial, Capital IQ, Morgan Stanley and Company reports
Equity
Value
21,082
6,455
9.327
17,650
961
12,043
2,973
3.111
1,445
8,756
Aggregate
Value
31,232
7,377
9.866
21,661
1,408
13,543
3,593
5.500
3,073
13,796
EBITDAX
2016
10.1x
9.4x
12.6x
11.2x
11.4x
12.1x
11.1x
9.4x
12.6x
14.2x
9.0x
8.3x
10.0x
10.4x
8.3x
14,2x
10.8x
2017
8.9x
11.6x
10.4x
10.7x
11.6x
10.4x 1
8.9x
11.6x1
13.4x
8.5x
8.0x
9.5x
9.9x
8.0x
13.4x
10.2x
2015 EPS
Payout
0%
81%
27%
0%
52%
31%
0%
81%
35%
74%
0%
35%
36%
0%
74%
33%
Strictly Confidential
Dividend
Yield
1.3%
0.0%
2.8%
1.5%
0.0%
2.1%
1.3%
0.0%
2.8%
1.6%
4.5%
0.0%
2.6%
2.2%
0.0%
4.5%
1.6%
Debt!
Trailing Debt Total
EBITDA Market Cap
3.7x
1.8x
22x
2.6x
5.1x
2.0x
2.9x
1.8x
5.1x
3.4x
4.6x
4.3x
3.8x
4.0x
3.4x
4.6x
3.4x
34%
18%
15%
19%
38%
17%
23%
15%
38%
21%
47%
54%
37%
40%
21%
54%
30%
18View entire presentation