Evercore Investment Banking Pitch Book
Financial Analysis
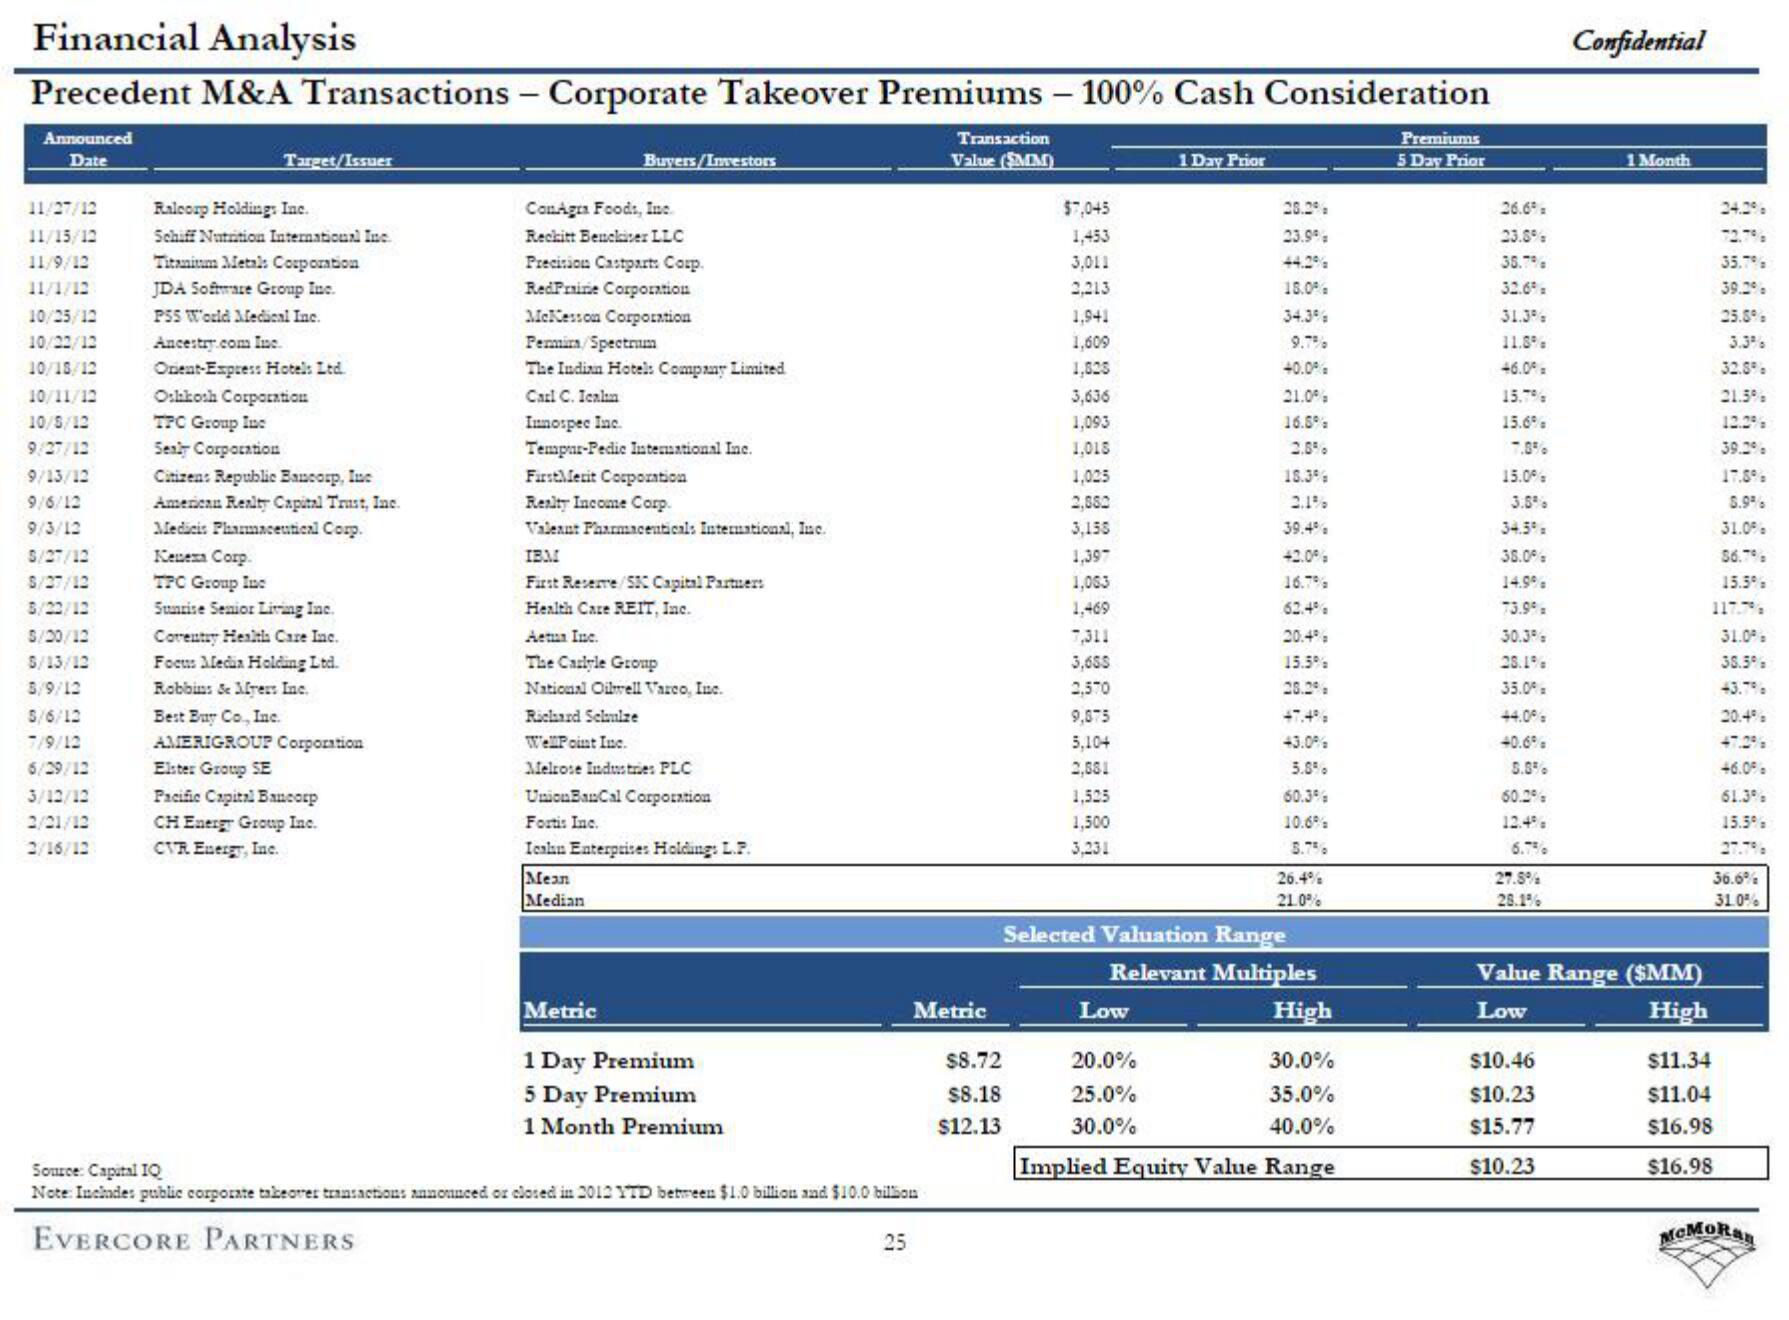
Precedent M&A Transactions - Corporate Takeover Premiums - 100% Cash Consideration
Announced
Date
11/27/12 Ralcorp Holdings Inc.
11/15/12
11/9/12
11/1/12
10/25/12
10/22/12
10/18/12
10/11/12
10/8/12
9/27/12
9/13/12
9/6/12
9/3/12
5/27/12
S/27/12
3/22/12
5/20/12
S/13/12
5/9/12
5/6/12
7/9/12
6/29/12
3/12/12
2/21/12
2/16/12
Target/Issuer
Schiff Nutrition International Inc.
Titanium Metals Corporation
JDA Software Group Inc.
PSS World Medical Inc.
Ancestry.com Inc.
Onent Express Hotels Ltd.
Oshkosh Corporation
TPC Group Inc
Sealy Corporation
Citizen: Republic Bancorp, Inc
American Realty Capital Trust, Inc.
Medicis Pharmaceutical Corp.
Kenema Corp.
TPC Group Inc
Sunrise Senior Living Inc.
Coventry Health Care Inc.
Focus Media Holding Ltd.
Robbins & Myers Inc.
Best Buy Co., Inc.
AMERIGROUP Corporation
Elster Group SE
Pacific Capital Bancorp
CH Energy Group Inc.
CVR Energy, Inc.
Buyers/Investors
ConAgra Foods, Inc.
Reckitt Benckiser LLC
Precision Castpart: Corp.
RedPrairie Corporation
McKesson Corporation
Permis/Spectrum
The Indian Hotels Company Limited.
Carl C. Icalin
Innospec Inc.
Tempur-Pedic International Inc.
FirstMerit Corporation
Realty Income Corp.
Valeant Pharmaceuticals International, Inc.
IBM
First Reserve SKC Capital Partners
Health Care REIT, Inc.
Actus Inc.
The Carlyle Group
National Oilwell Varco, Inc.
Richard Schulze
WellPoint Inc.
Melrose Industries PLC
UnionBanCal Corporation
Fortis Inc.
Icahn Enterprises Holdings L.P.
Mean
Median
Metric
1 Day Premium
5 Day Premium
1 Month Premium
Source: Capital IQ
Note: Includes public corporate takeover transactions announced or closed in 2012 YTD between $1.0 billion and $10.0 bilion
EVERCORE PARTNERS
25
Transaction
Value (MM)
Metric
$8.72
$8.18
$12.13
$7,045
1,453
3,011
2,213
1,941
1,609
1,825
3,636
1,093
1,015
1,025
2,882
3,155
1,397
1,063
1,469
7,311
3,655
2,570
9,875
5.104
2,881
1.525
1,500
3,231
1 Day Prior
26.2%,
23.9%
44.2%
15.0%
34.3%
9.7%
40.0%
21.0%
16.5%
2.8%
15.3%
Low
39.4%
42.0%
16.7%
62.4%
20.0%
25.0%
30.0%
20.4%
15.5%
47.4%
43.0%
5.8%
60.3%
10.6%
5.7%
Selected Valuation Range
26.4%
21.0%
Relevant Multiples
High
30.0%
35.0%
40.0%
Implied Equity Value Range
Premiums
5 Day Prior
26.69
23.8%
35.7%
32.6% =
31.3%
11.8%
46.0%=
15.7%
15.6%
7.8%
15.0%
3.5%
34.5%
35.0%
14.9%
73.9% =
30.3%
28.1%
35.0⁰ a
44.0%
40.6%
5.8%
60.2%
12.4%
6.7%
27.8%
28.1%
Confidential
$10.46
$10.23
$15.77
$10.23
1 Month
Value Range ($MM)
Low
High
24.2%
72.7%
35.7%
39.2%
25.8%
3.3%
32.8%
21.5%
12.29
39.2%
$11.34
$11.04
$16.98
$16.98
17.5%
8.9%
31.0%
56.7%
15.5%
117.7%
31.09
38.5%
43.7%
20.49
47.2%
+6.0%
61.3%
15.5%
36.6%
31.0%
MCMORanView entire presentation