Maersk Investor Presentation Deck slide image

Maersk Investor Presentation Deck

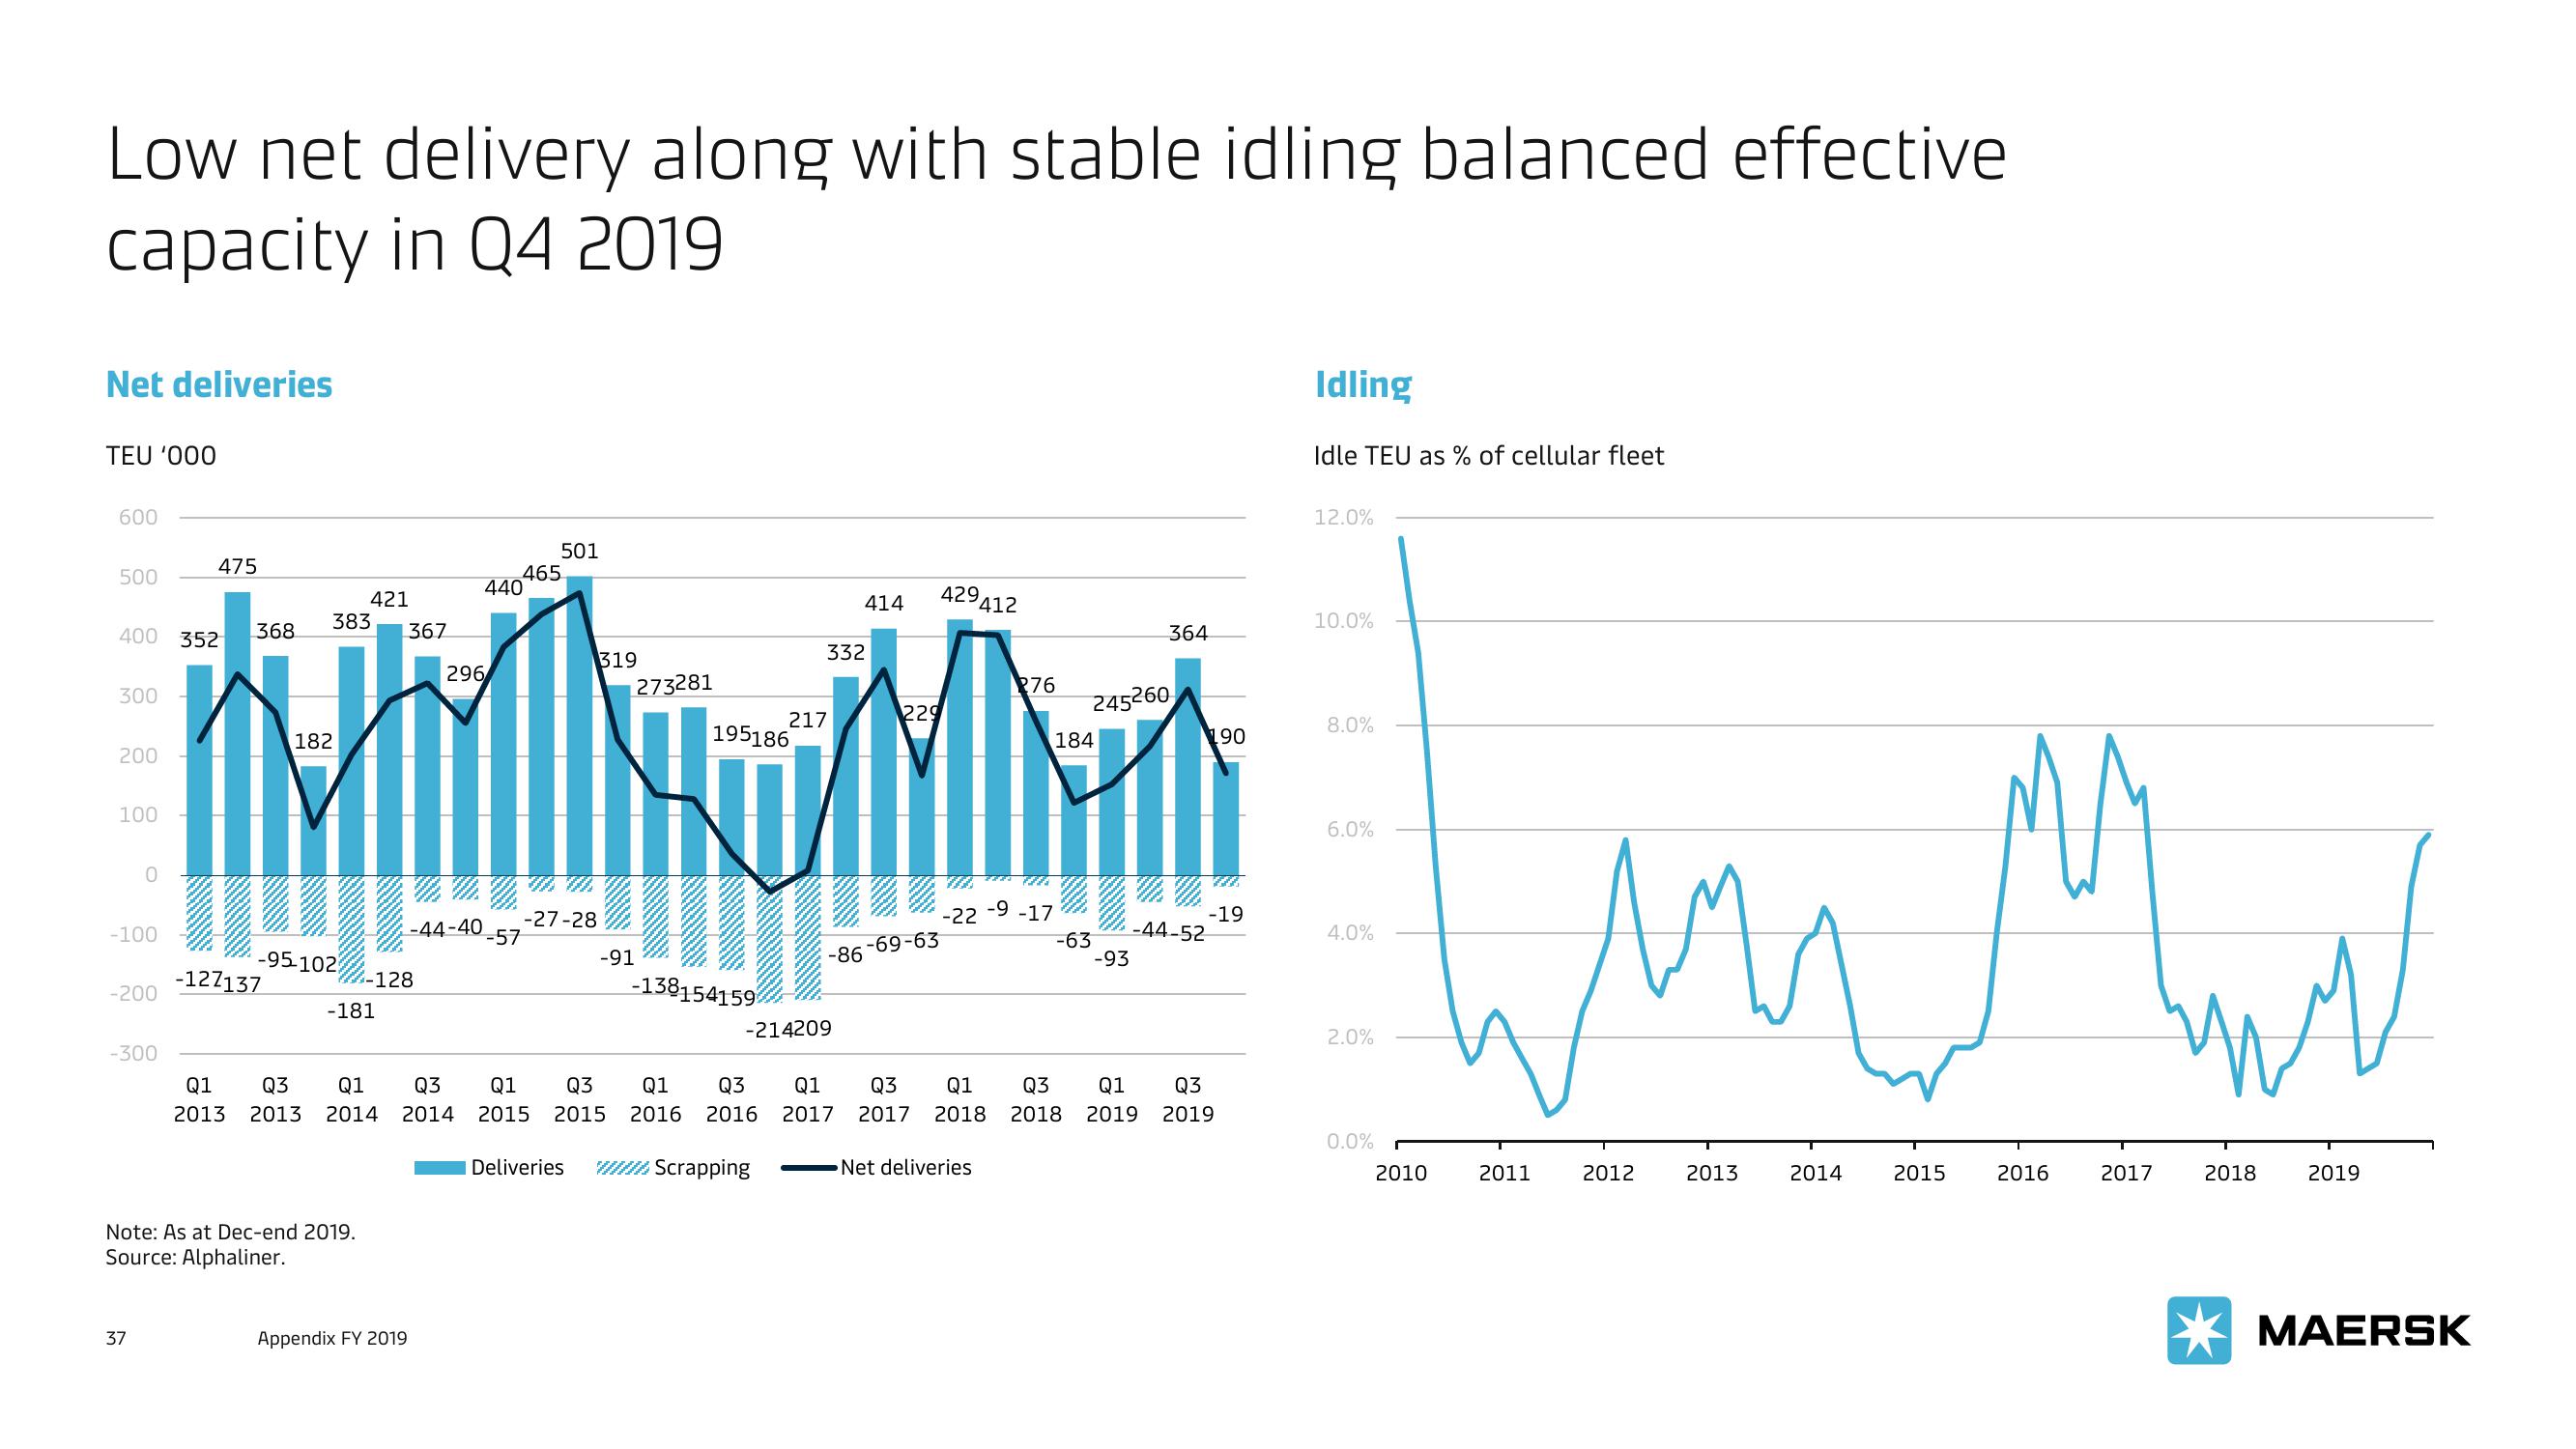
Low net delivery along with stable idling balanced effective capacity in Q4 2019 Net deliveries TEU '000 600 500 400 352 300 200 100 0 -100 -200 -300 475 37 368 -127137 383 182 -95-102 421 Note: As at Dec-end 2019. Source: Alphaliner. -181 367 -128 Appendix FY 2019 -44-40 296 440 465 501 -27-28 -57 319 273281 -91 195186 -138154159 Q1 Q3 Q1 Q3 Q1 Q3 Q1 Q3 2013 2013 2014 2014 2015 2015 2016 2016 Deliveries ///////Scrapping 217 332 -86 -214209 414 429 229 -69-63 412 276 Net deliveries -22 -9 -17 184 245260 -63 364 -93 -44-52 190 -19 Q1 Q3 Q1 Q3 Q1 Q3 2017 2017 2018 2018 2019 2019 Idling Idle TEU as % of cellular fleet 12.0% 10.0% 8.0% 6.0% 4.0% 2.0% 0.0% 2010 2011 ли 2012 2013 2014 2015 MM 2016 2017 2018 2019 MAERSK
View entire presentation