Spring 2023 Solar Industry Update
•
Chinese Generation Capacity
Additions by Source
Note: Based on new information, annual and cumulative solar values now assume
that China's National Energy Administration (NEA) reports distributed PV in direct
current terms and utility-scale PV in alternating current terms.
Sources: China NEA (1/18/23); IEA, National Survey Report of PV Power
Applications in China, 2021.
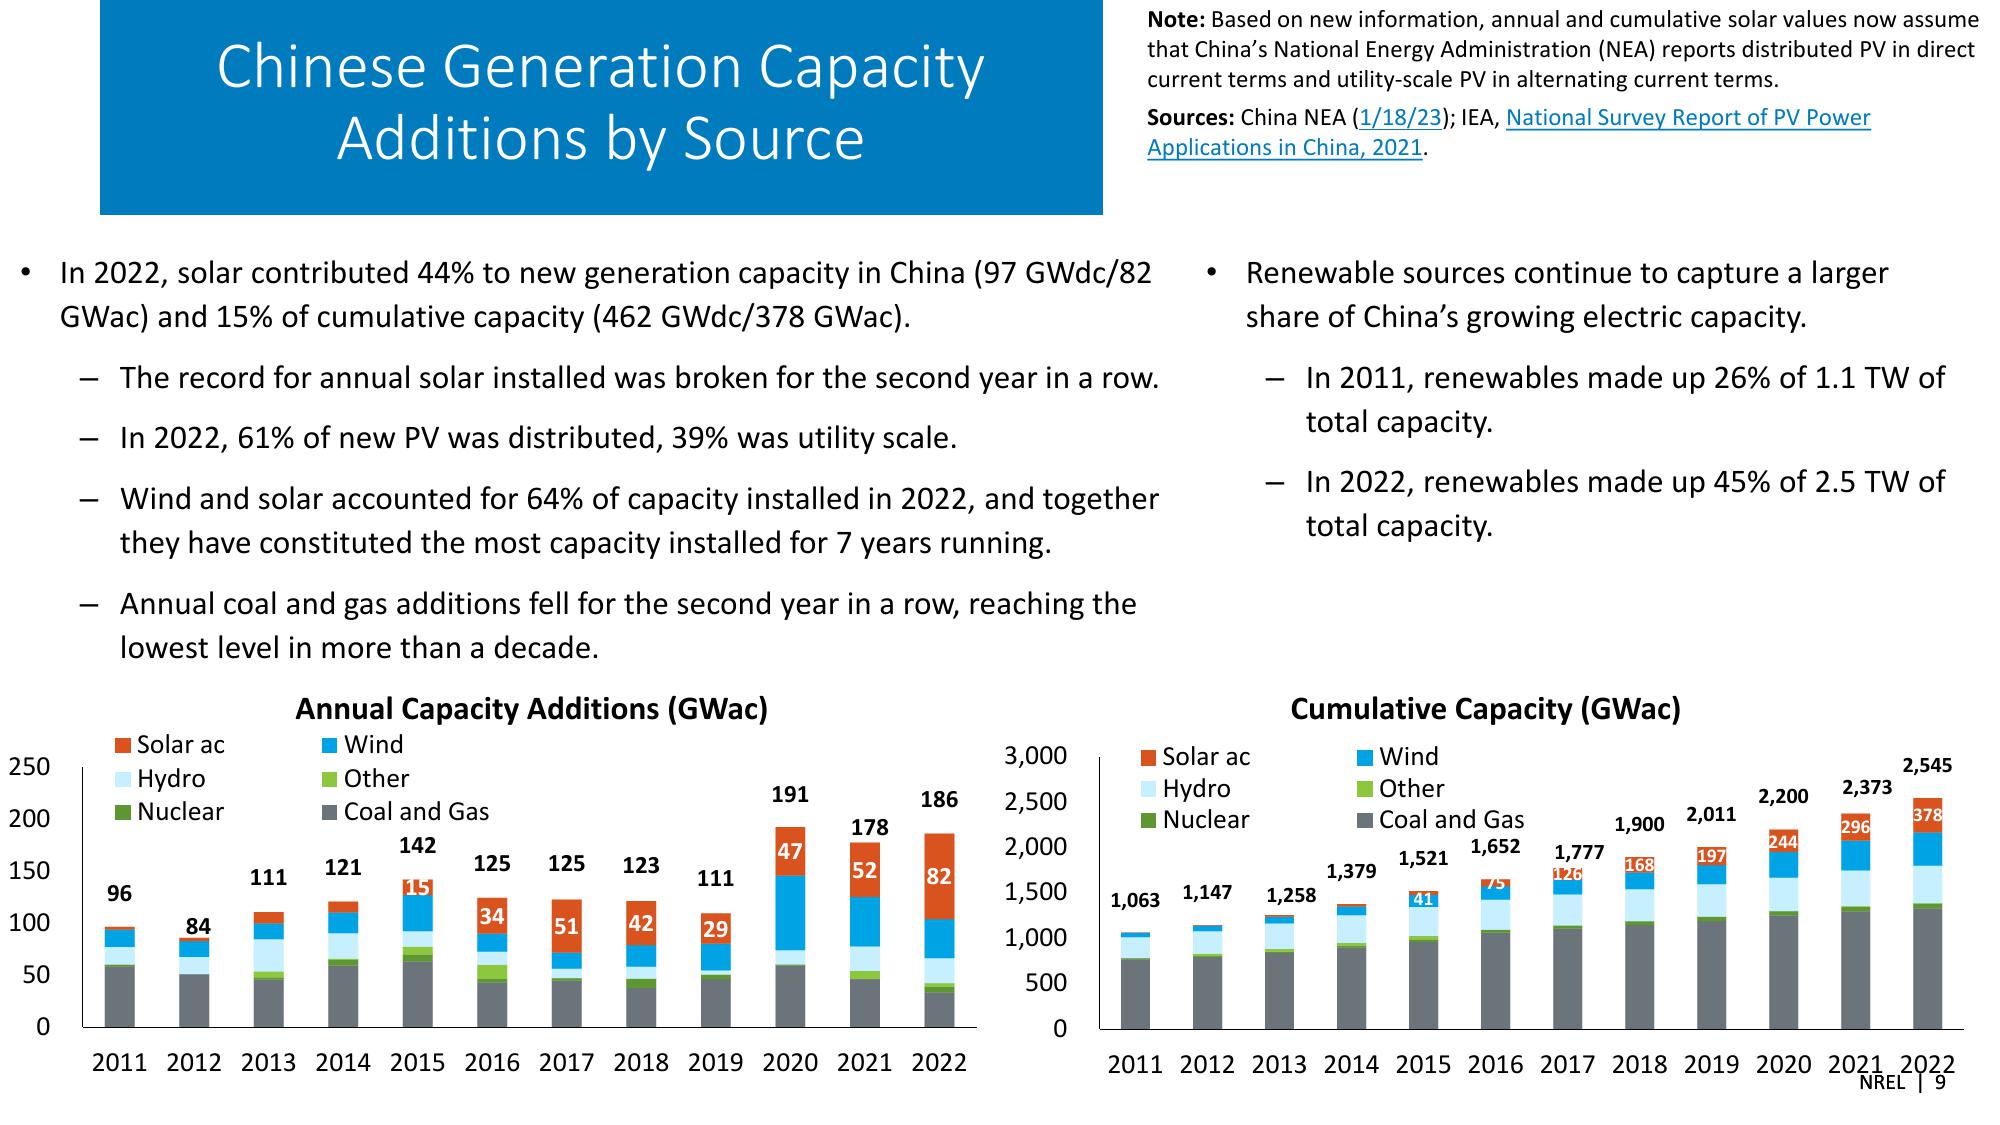
In 2022, solar contributed 44% to new generation capacity in China (97 GWdc/82
GWac) and 15% of cumulative capacity (462 GWdc/378 GWac).
―
-
-
-
The record for annual solar installed was broken for the second year in a row.
In 2022, 61% of new PV was distributed, 39% was utility scale.
Wind and solar accounted for 64% of capacity installed in 2022, and together
they have constituted the most capacity installed for 7 years running.
Annual coal and gas additions fell for the second year in a row, reaching the
lowest level in more than a decade.
•
Renewable sources continue to capture a larger
share of China's growing electric capacity.
In 2011, renewables made up 26% of 1.1 TW of
total capacity.
In 2022, renewables made up 45% of 2.5 TW of
total capacity.
Annual Capacity Additions (GWac)
Cumulative Capacity (GWac)
Solar ac
250
Hydro
Wind
Other
3,000
Solar ac
Wind
2,545
191
200
Nuclear
Coal and Gas
186
2,500
Hydro
Other
2,200
178
Nuclear
142
47
2,000
Coal and Gas
1,652
2,011
1,900
2,373
296
378
244
150
121
125
125
123
1,521
111
52
96
15
111
82
1,379
1,777
126
197
168
1,500
100
34
1,063 1,147 1,258
75
41
84
51
42
29
1,000
50
500
0
0
2011 2012 2013 2014 2015 2016 2017 2018 2019 2020 2021 2022
2011 2012 2013 2014 2015 2016 2017 2018 2019 2020 2021 2022
NREL 9View entire presentation