Carlyle Investor Day Presentation Deck
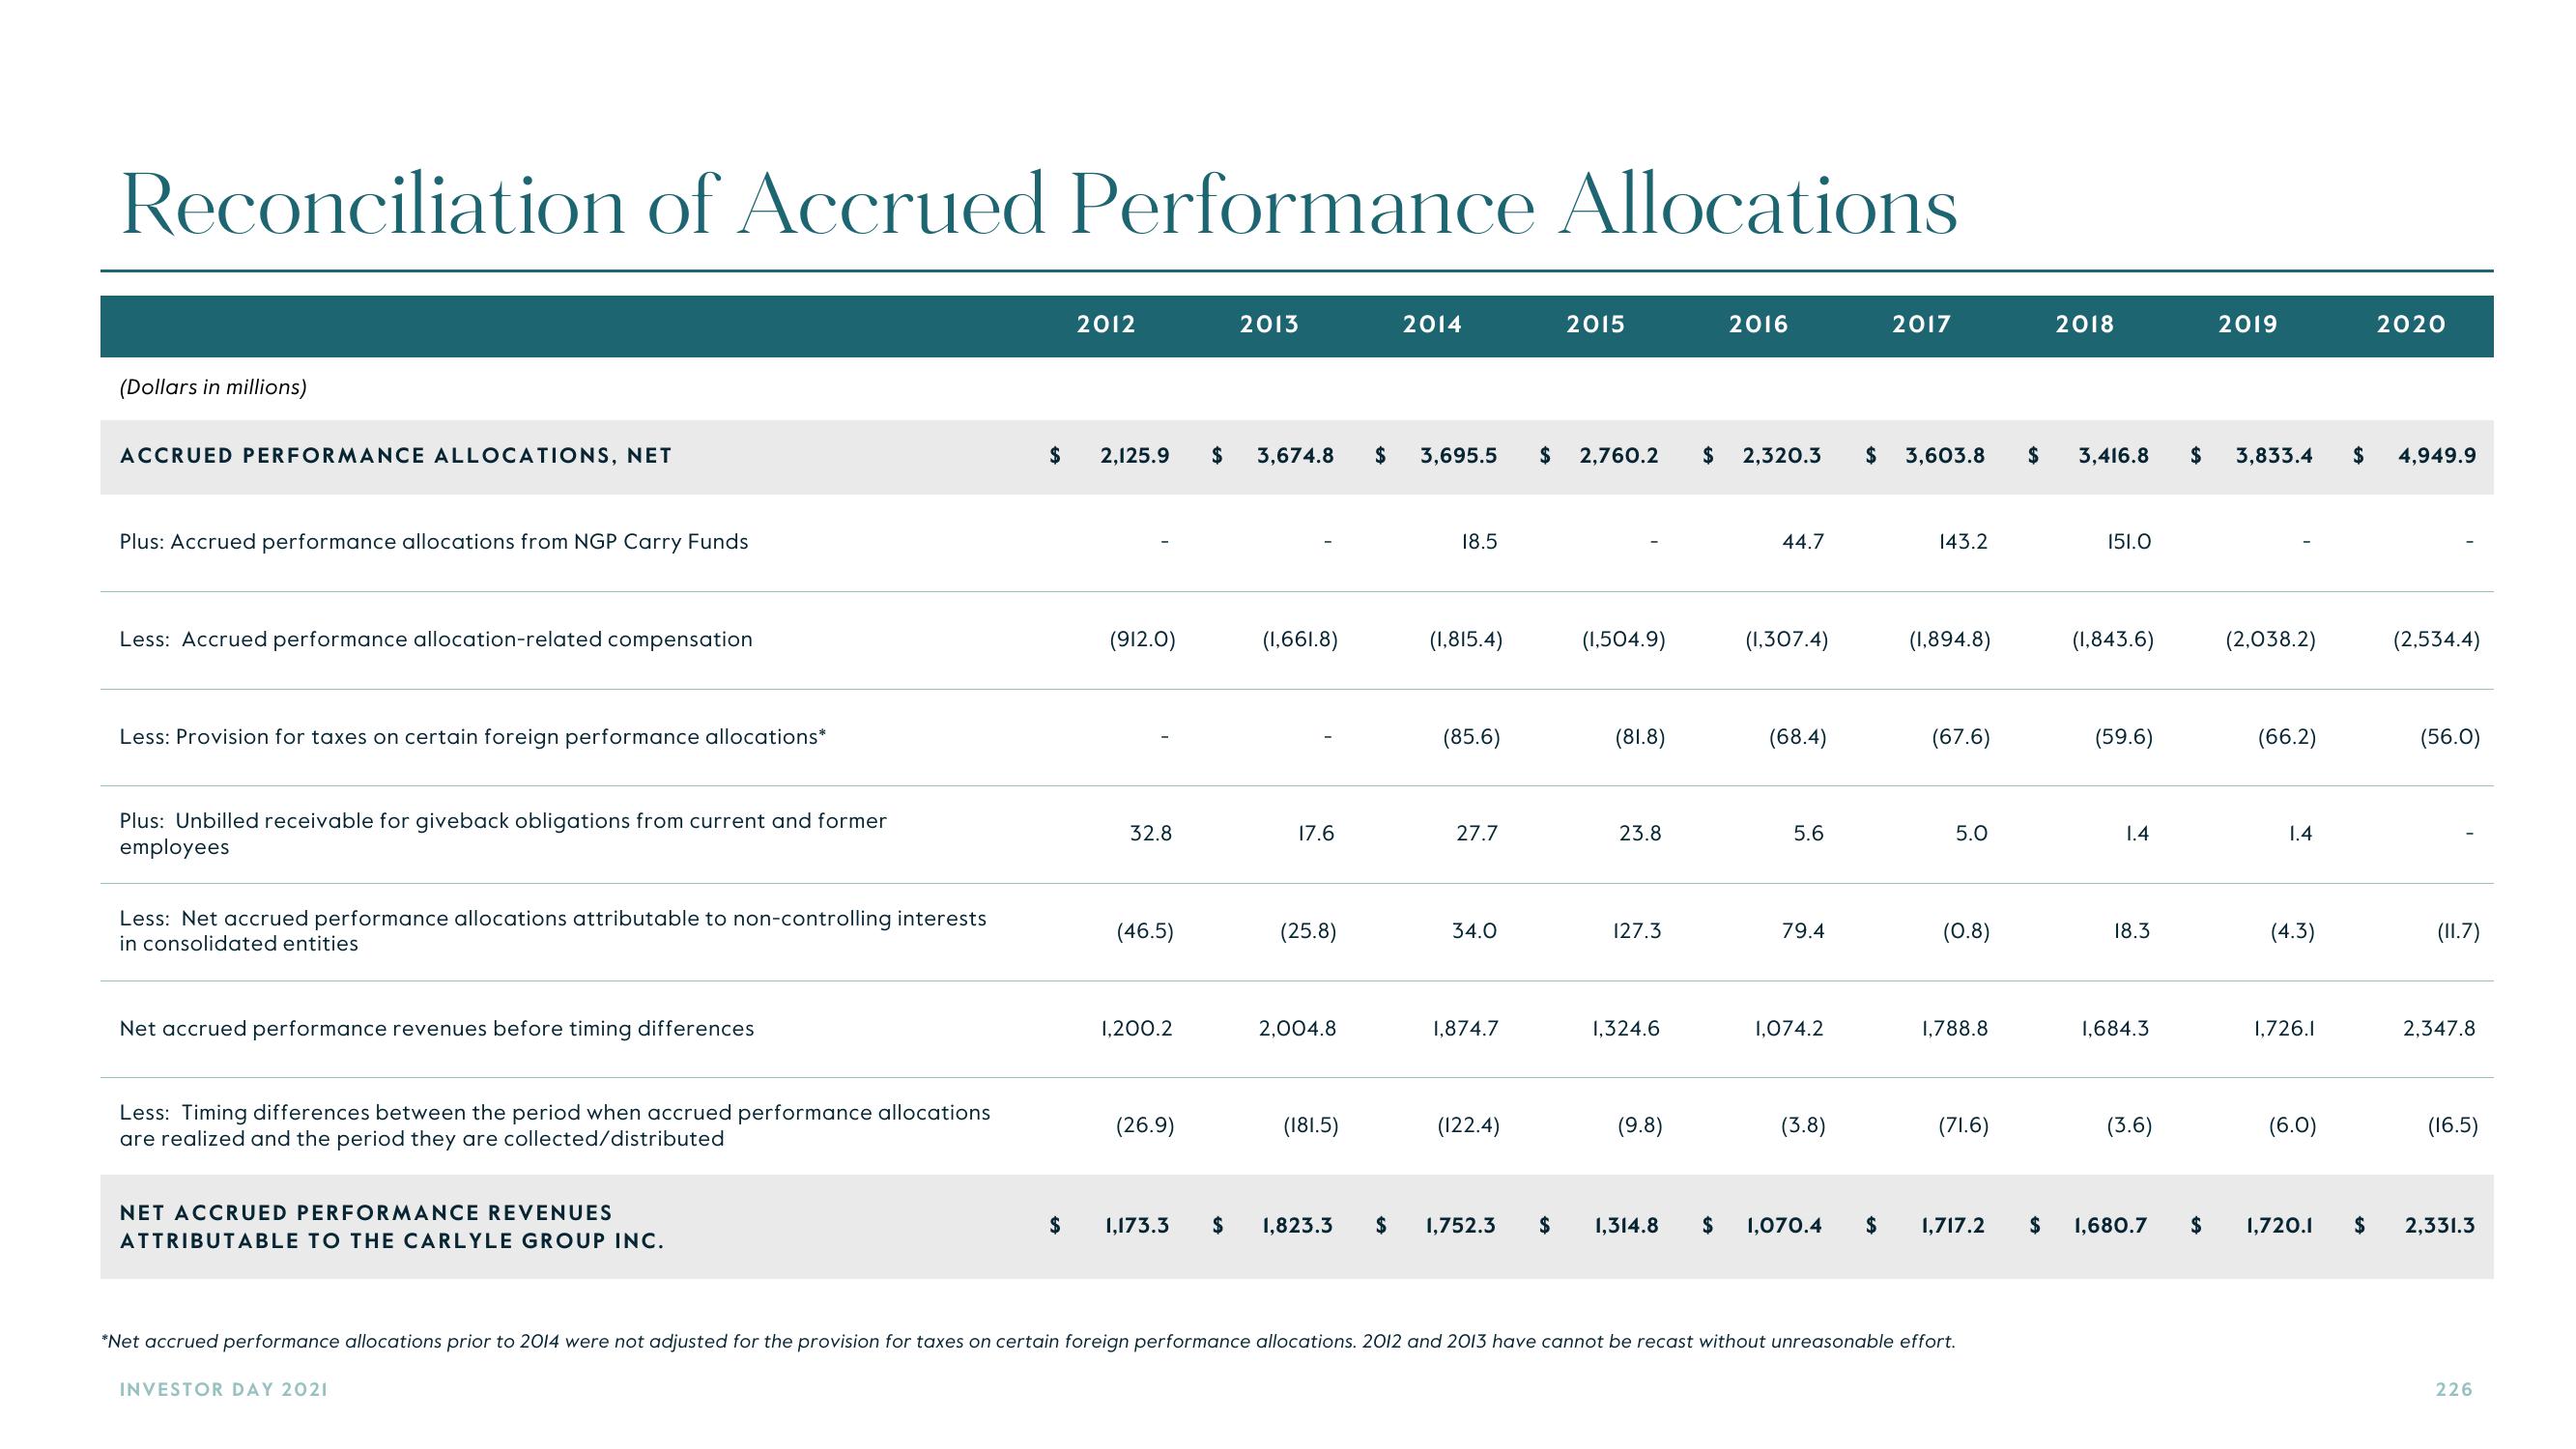
Reconciliation of Accrued Performance Allocations
(Dollars in millions)
ACCRUED PERFORMANCE ALLOCATIONS, NET
Plus: Accrued performance allocations from NGP Carry Funds
Less: Accrued performance allocation-related compensation
Less: Provision for taxes on certain foreign performance allocations*
Plus: Unbilled receivable for giveback obligations from current and former
employees
Less: Net accrued performance allocations attributable to non-controlling interests
in consolidated entities
Net accrued performance revenues before timing differences
Less: Timing differences between the period when accrued performance allocations
are realized and the period they are collected/distributed
NET ACCRUED PERFORMANCE REVENUES
ATTRIBUTABLE TO THE CARLYLE GROUP INC.
2012
INVESTOR DAY 2021
(912.0)
$ 2,125.9 $ 3,674.8 $ 3,695.5
32.8
(46.5)
1,200.2
2013
(26.9)
(1,661.8)
17.6
(25.8)
2,004.8
2014
(181.5)
18.5
(1,815.4)
(85.6)
27.7
34.0
1,874.7
(122.4)
2015
$ 2,760.2 $ 2,320.3
(1,504.9)
(81.8)
23.8
127.3
1,324.6
2016
(9.8)
44.7
(1,307.4)
(68.4)
5.6
79.4
1,074.2
(3.8)
2017
$ 3,603.8
143.2
(1,894.8)
(67.6)
5.0
(0.8)
1,788.8
(71.6)
$ 1,173.3 $ 1,823.3 $ 1,752.3 $ 1,314.8 $ 1,070.4 $ 1,717.2
*Net accrued performance allocations prior to 2014 were not adjusted for the provision for taxes on certain foreign performance allocations. 2012 and 2013 have cannot be recast without unreasonable effort.
2018
$ 3,416.8
151.0
(1,843.6)
(59.6)
1.4
18.3
1,684.3
(3.6)
$ 1,680.7
$
$
2019
3,833.4
(2,038.2)
(66.2)
1.4
(4.3)
1,726.1
(6.0)
1,720.1
2020
$ 4,949.9
(2,534.4)
(56.0)
(11.7)
2,347.8
(16.5)
$ 2,331.3
226View entire presentation