Enfusion Results Presentation Deck
*:enfusion
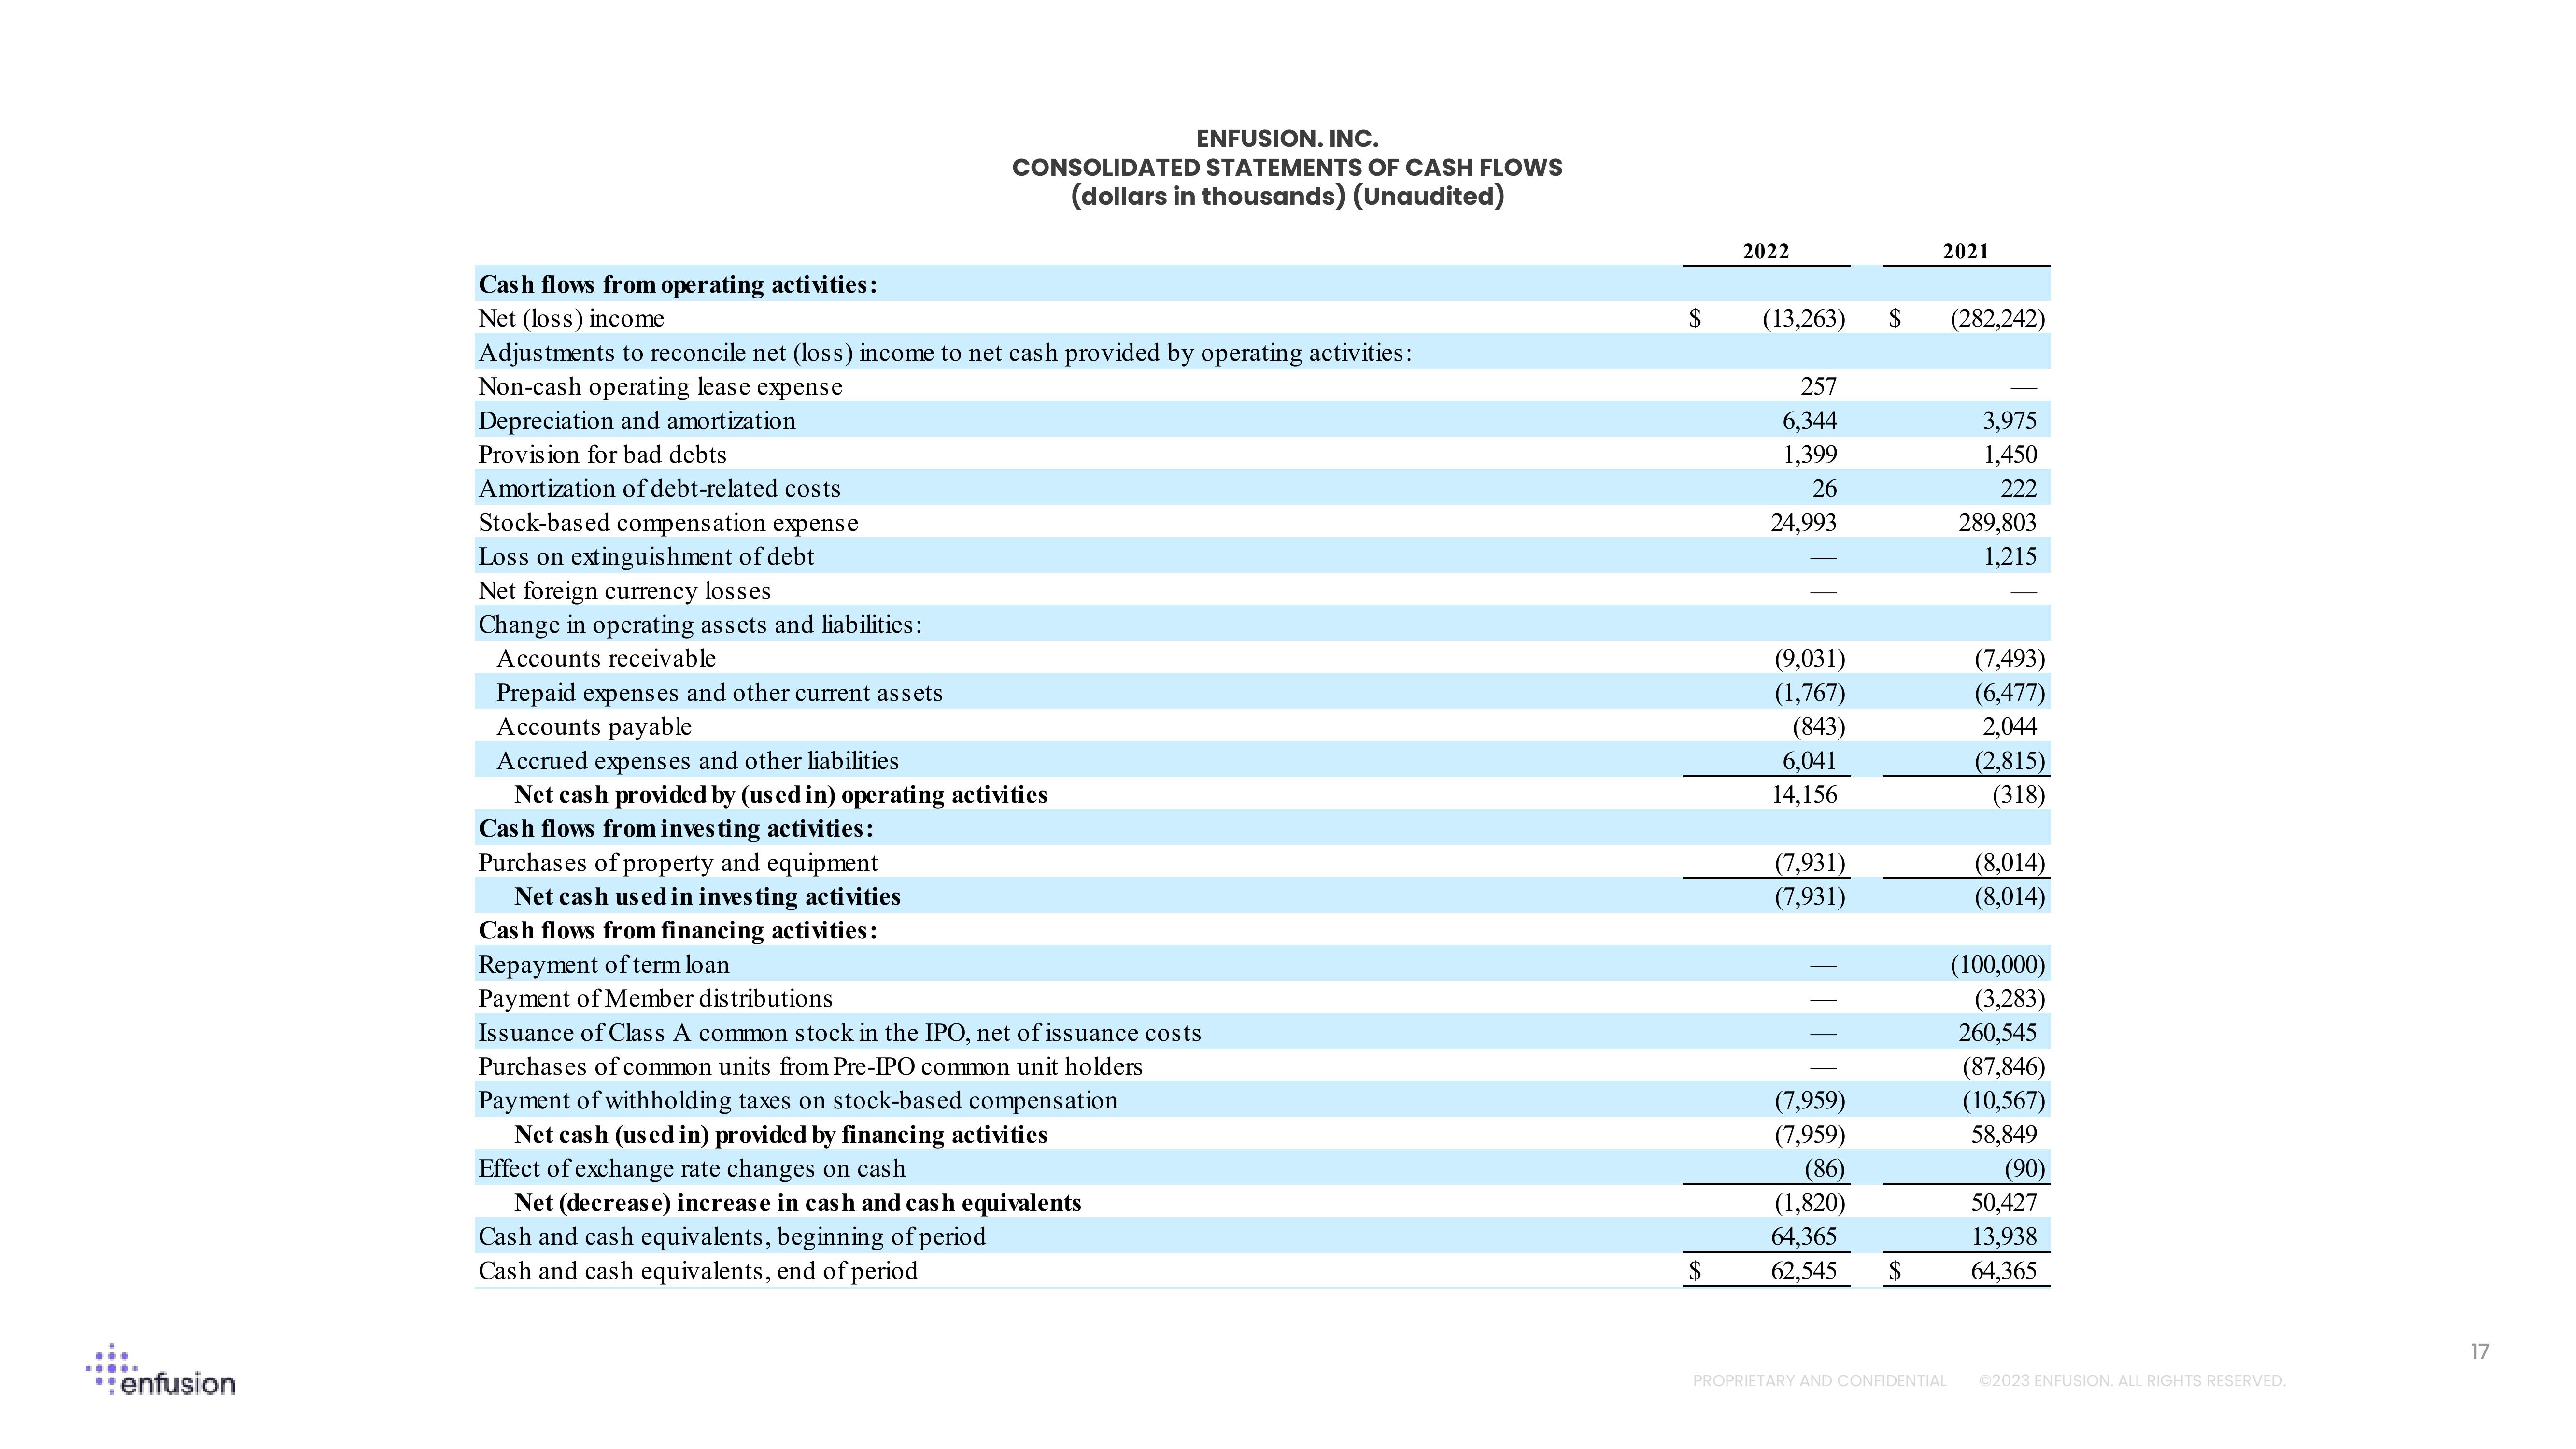
ENFUSION. INC.
CONSOLIDATED STATEMENTS OF CASH FLOWS
(dollars in thousands) (Unaudited)
Cash flows from operating activities:
Net (loss) income
Adjustments to reconcile net (loss) income to net cash provided by operating activities:
Non-cash operating lease expense
Depreciation and amortization
Provision for bad debts
Amortization of debt-related costs
Stock-based compensation expense
Loss on extinguishment of debt
Net foreign currency losses
Change in operating assets and liabilities:
Accounts receivable
Prepaid expenses and other current assets
Accounts payable
Accrued expenses and other liabilities
Net cash provided by (used in) operating activities
Cash flows from investing activities:
Purchases of property and equipment
Net cash used in investing activities
Cash flows from financing activities:
Repayment of term loan
Payment of Member distributions
Issuance of Class A common stock in the IPO, net of issuance costs
Purchases of common units from Pre-IPO common unit holders
Payment of withholding taxes on stock-based compensation
Net cash (used in) provided by financing activities
Effect of exchange rate changes on cash
Net (decrease) increase in cash and cash equivalents
Cash and cash equivalents, beginning of period
Cash and cash equivalents, end of period
$
$
2022
(13,263)
257
6,344
1,399
26
24,993
(9,031)
(1,767)
(843)
6,041
14,156
(7,931)
(7,931)
(7,959)
(7,959)
(86)
(1,820)
64,365
62,545
$
$
2021
PROPRIETARY AND CONFIDENTIAL
(282,242)
3,975
1,450
222
289,803
1,215
(7,493)
(6,477)
2,044
(2,815)
(318)
(8,014)
(8,014)
(100,000)
(3,283)
260,545
(87,846)
(10,567)
58,849
(90)
50,427
13,938
64,365
Ⓒ2023 ENFUSION. ALL RIGHTS RESERVED.
17View entire presentation