Snap Inc Results Presentation Deck
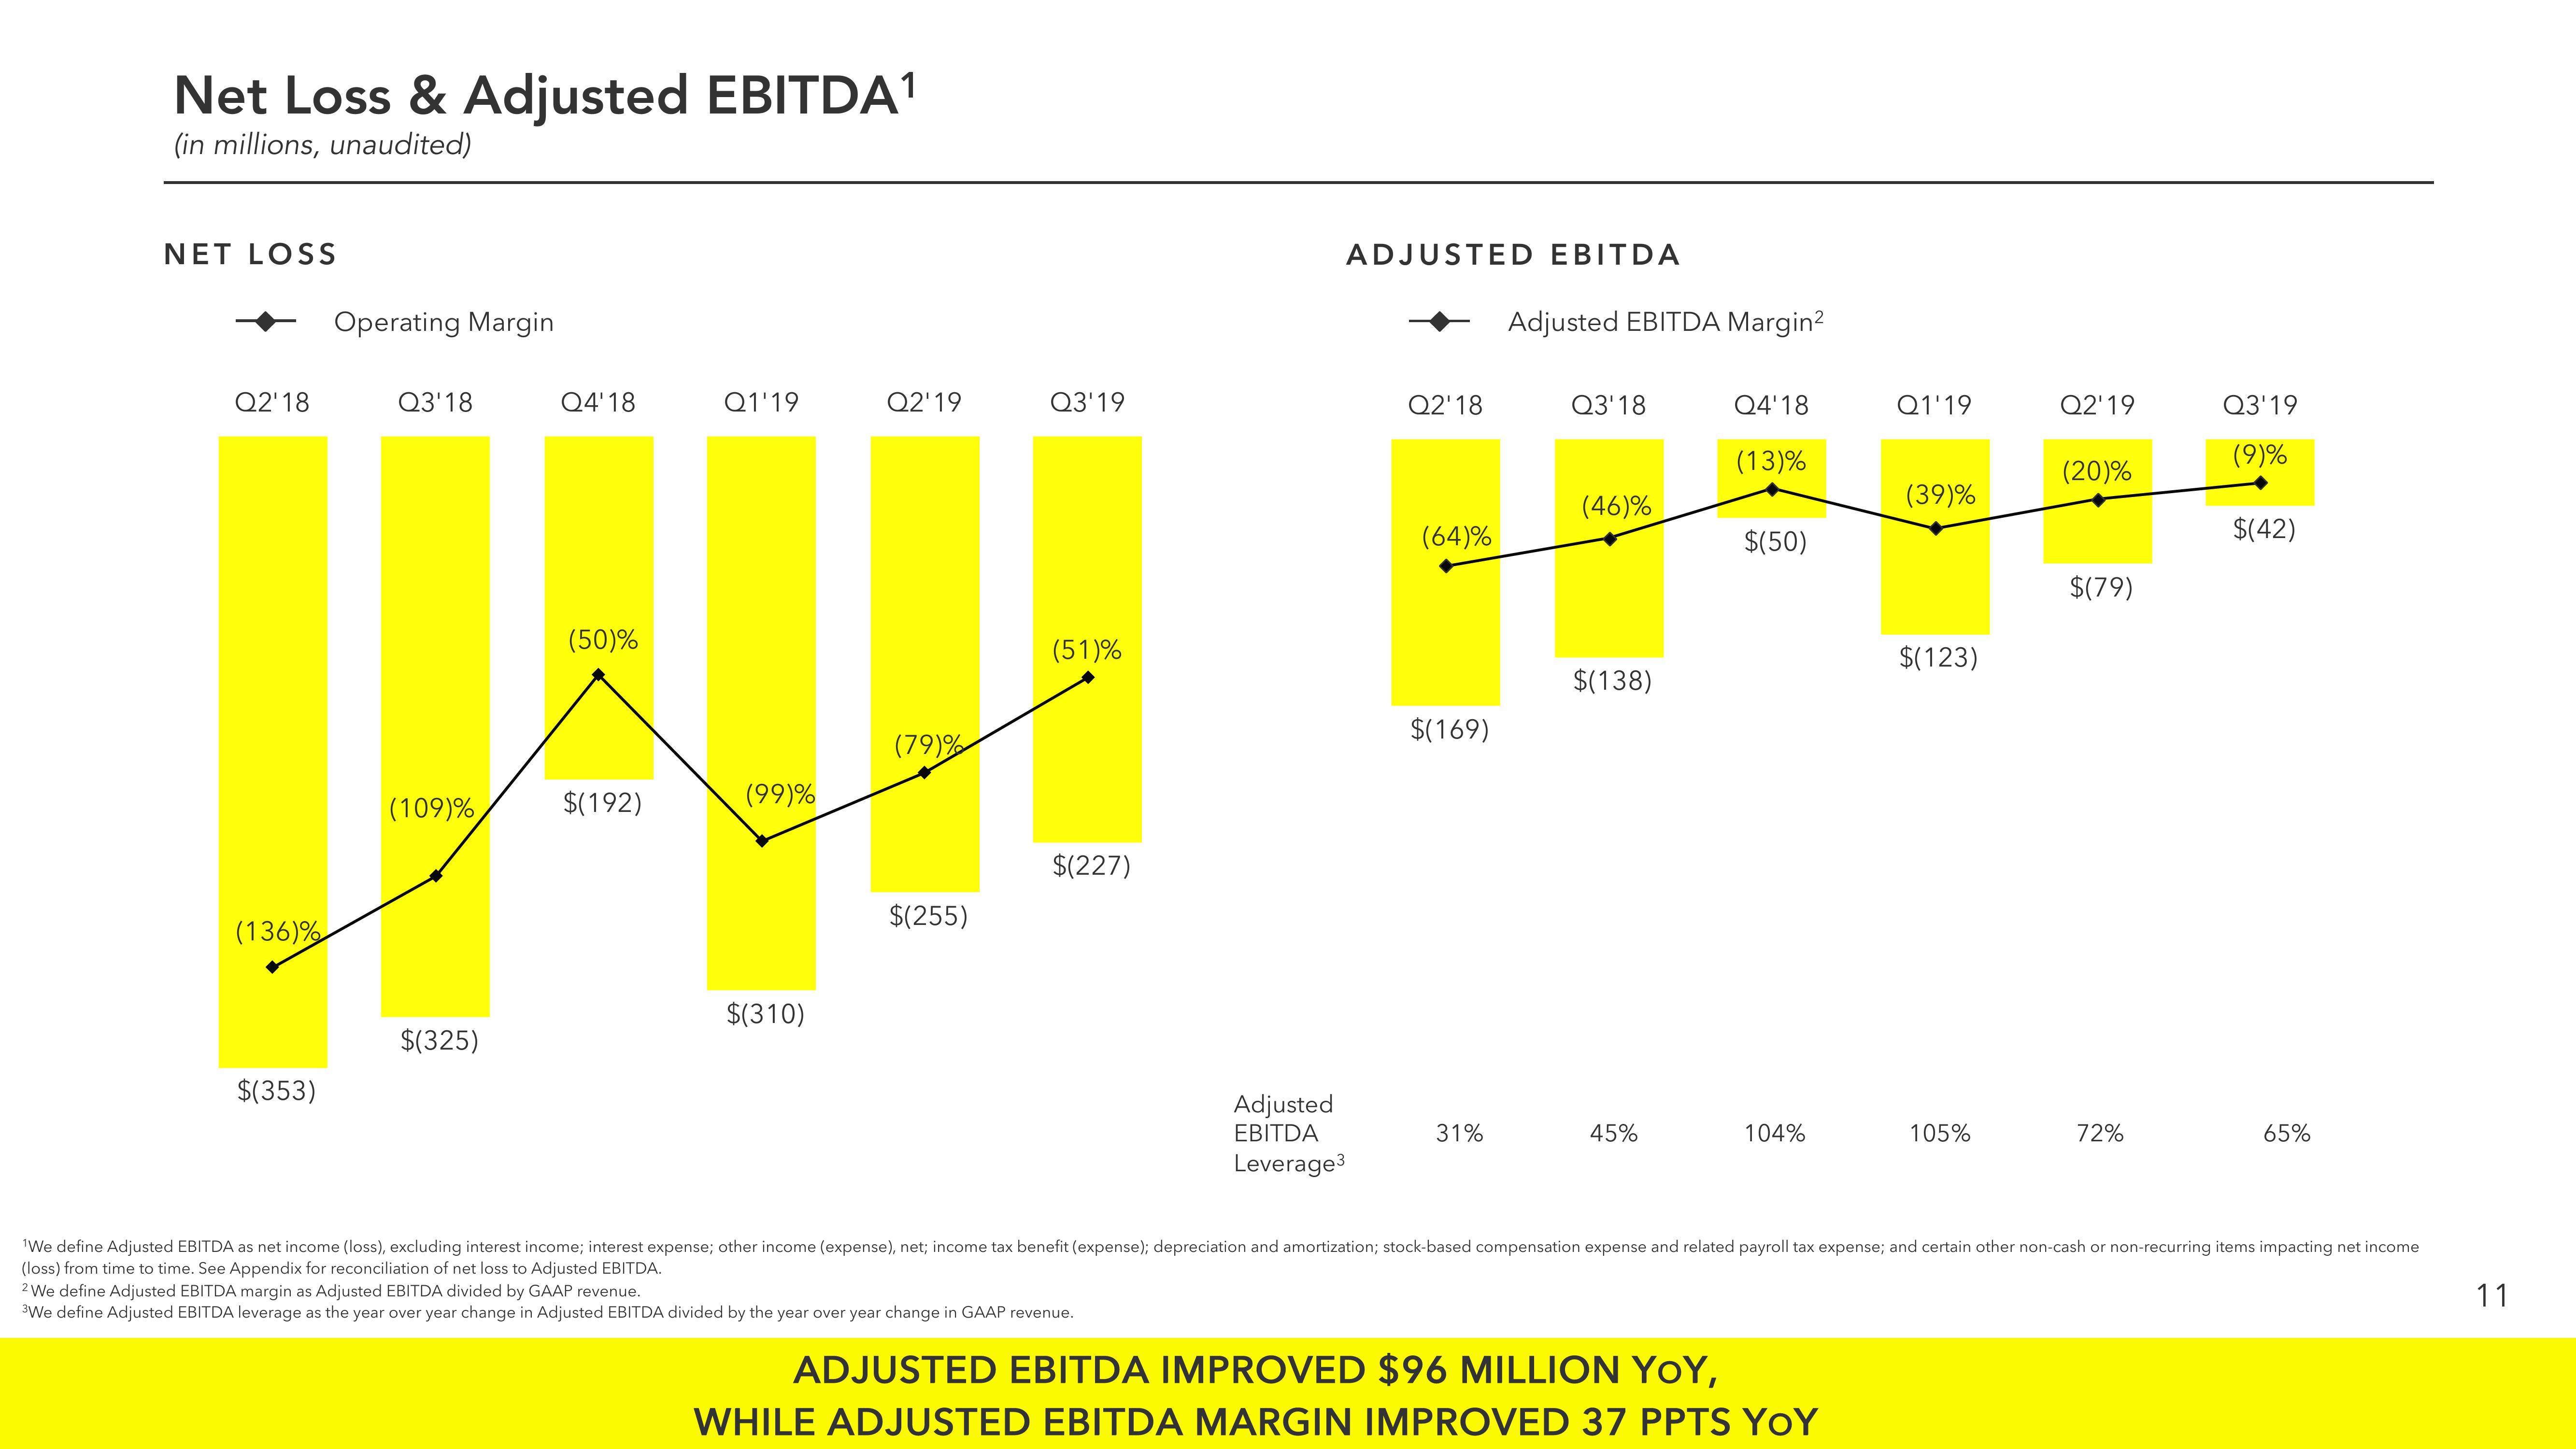
Net Loss & Adjusted EBITDA¹
(in millions, unaudited)
NET LOSS
Q2'18
(136)%
$(353)
Operating Margin
Q3'18
(109)%
$(325)
Q4'18
(50)%
$(192)
Q1'19
(99)%
$(310)
Q2'19
(79)%
$(255)
Q3'19
(51)%
$(227)
ADJUSTED EBITDA
2 We define Adjusted EBITDA margin as Adjusted EBITDA divided by GAAP revenue.
³We define Adjusted EBITDA leverage as the year over year change in Adjusted EBITDA divided by the year over year change in GAAP revenue.
Adjusted
EBITDA
Leverage³
Q2'18
(64)%
$(169)
31%
Adjusted EBITDA Margin²
Q3'18
(46)%
$(138)
45%
Q4'18
(13)%
$(50)
104%
Q1'19
ADJUSTED EBITDA IMPROVED $96 MILLION YOY,
WHILE ADJUSTED EBITDA MARGIN IMPROVED 37 PPTS YOY
(39)%
$(123)
105%
Q2'19
(20)%
$(79)
72%
Q3'19
(9)%
$(42)
'We define Adjusted EBITDA as net income (loss), excluding interest income; interest expense; other income (expense), net; income tax benefit (expense); depreciation and amortization; stock-based compensation expense and related payroll tax expense; and certain other non-cash or non-recurring items impacting net income
(loss) from time to time. See Appendix for reconciliation of net loss to Adjusted EBITDA.
65%
11View entire presentation